Your query returned 137 graphics.
Results 46 - 60
Atmosphere-surface exchangeSchematic diagram of processes of atmosphere-surface exchange |

|
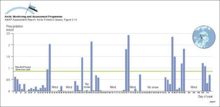
Precipitation rate measurements from Alert from January through April 1992 showing periods of no snow, periods of no snow measured due to wind events, and the relatively large quantities of precipitation on days duringPrecipitation rate measurements from Alert from January through April 1992 showing periods of no snow, periods of no snow measured due to wind events, and the relatively large quantities of [..] |
|
Distribution of organochlorine contaminants (OCs) in Arctic air, snow, seawater, and the marine mammals food chain Data for the six major classes of OCs are plotted for each compartment or species as the percent ofDistribution of organochlorine contaminants (OCs) in Arctic air, snow, seawater, and the marine mammals food chain Data for the six major classes of OCs are plotted for each compartment or species as [..] |

|
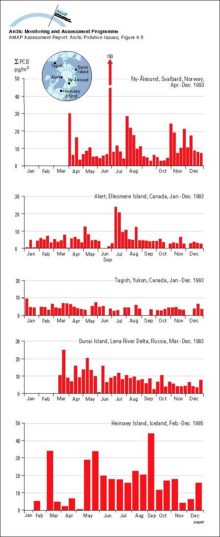
Concentrations of sum-HCH in Arctic airConcentrations of sum-HCH in Arctic air |

|
Source regions for HCH, chlordane, toxaphene, and PCBs in Arctic air based on 5-day back-trajectories for elevated air concentrations at Tagish, Alert, and Ny-ÅlesundSource regions for HCH, chlordane, toxaphene, and PCBs in Arctic air based on 5-day back-trajectories for elevated air concentrations at Tagish, Alert, and Ny-Ålesund |

|
Concentrations of sum-PCB in Arctic air (sum of CBs 28, 31, 52, 101, 105, 118, 138, 153, 156, 180)Concentrations of sum-PCB in Arctic air (sum of CBs 28, 31, 52, 101, 105, 118, 138, 153, 156, 180) |
|
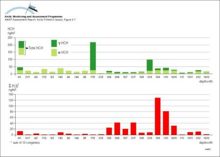
Flux of HCH and sum-PCB (sum of 10 congeners) in precipitation at Heimaey Island, IcelandFlux of HCH and sum-PCB (sum of 10 congeners) in precipitation at Heimaey Island, Iceland |
|
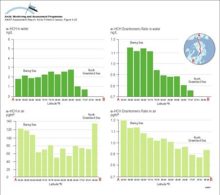
Trends in alpha-HCH and enantiomer ratios (ER) on a transect from the Bering Sea across the polar cap to the Greenland Sea during the Arctic Ocean Transect Study of July and August 1994Trends in alpha-HCH and enantiomer ratios (ER) on a transect from the Bering Sea across the polar cap to the Greenland Sea during the Arctic Ocean Transect Study of July and August 1994 |
|
Water/air fugacity ratios (fw/fa) of alpha-HCH and gamma-HCH on a transect from the Bering Sea to the Greenland Sea in July and August 1994 A fugacity ratio of 1 indicates air-water equilibriumWater/air fugacity ratios (fw/fa) of alpha-HCH and gamma-HCH on a transect from the Bering Sea to the Greenland Sea in July and August 1994 A fugacity ratio of 1 indicates air-water equilibrium |

|
Temporal trends in concentrations of sum-HCH and toxaphene in Arctic airTemporal trends in concentrations of sum-HCH and toxaphene in Arctic air |

|
Averaged upper (3000 m) air concentrations of Pb in winter (December-February) and summer (June-August) as modeled by the updated (1996) hemispheric EMEP transport model in a simulation for the reference year 1988Averaged upper (3000 m) air concentrations of Pb in winter (December-February) and summer (June-August) as modeled by the updated (1996) hemispheric EMEP transport model in a simulation for the [..] |

|
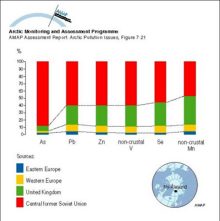
Average contributions from various sources to the atmospheric concentrations of elements in winter air samples at Ny-Ålesund, SvalbardAverage contributions from various sources to the atmospheric concentrations of elements in winter air samples at Ny-Ålesund, Svalbard |

|
Average regional source apportionment of metals in winter aerosol at Ny-Ålesund, Svalbard from Europe and the central part of the former Soviet Union (including the Urals and Norilsk)Average regional source apportionment of metals in winter aerosol at Ny-Ålesund, Svalbard from Europe and the central part of the former Soviet Union (including the Urals and Norilsk) |
|
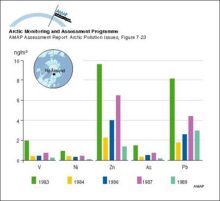
Atmospheric winter concentrations (median values) of metals measured in different years in the <25 µm aerosol fraction at Ny-Ålesund, SvalbardAtmospheric winter concentrations (median values) of metals measured in different years in the <25 µm aerosol fraction at Ny-Ålesund, Svalbard |
|
Composition of particles measured at different altitudes during winter flights in the Norwegian ArcticComposition of particles measured at different altitudes during winter flights in the Norwegian Arctic |

|

water OR waste searches for either of these words
oceans AND biodiversity searches for blocks with both words
pollution NEAR water searches for blocks with either of these words, with them being closer ranks higher
"climate change" searches for this phrase