Your query returned 209 graphics.
Results 16 - 30
Source regions for HCH, chlordane, toxaphene, and PCBs in Arctic air based on 5-day back-trajectories for elevated air concentrations at Tagish, Alert, and Ny-ÅlesundSource regions for HCH, chlordane, toxaphene, and PCBs in Arctic air based on 5-day back-trajectories for elevated air concentrations at Tagish, Alert, and Ny-Ålesund |

|
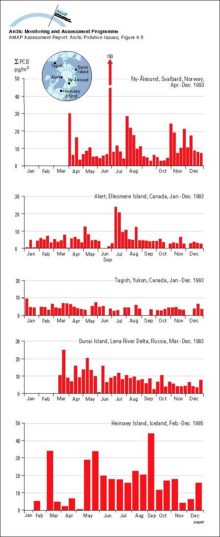
Concentrations of sum-PCB in Arctic air (sum of CBs 28, 31, 52, 101, 105, 118, 138, 153, 156, 180)Concentrations of sum-PCB in Arctic air (sum of CBs 28, 31, 52, 101, 105, 118, 138, 153, 156, 180) |
|
Flux of HCH and sum-PCB (sum of 10 congeners) in precipitation at Heimaey Island, IcelandFlux of HCH and sum-PCB (sum of 10 congeners) in precipitation at Heimaey Island, Iceland |
|
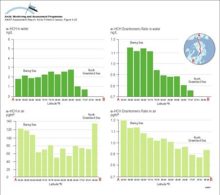
Trends in alpha-HCH and enantiomer ratios (ER) on a transect from the Bering Sea across the polar cap to the Greenland Sea during the Arctic Ocean Transect Study of July and August 1994Trends in alpha-HCH and enantiomer ratios (ER) on a transect from the Bering Sea across the polar cap to the Greenland Sea during the Arctic Ocean Transect Study of July and August 1994 |
|
Water/air fugacity ratios (fw/fa) of alpha-HCH and gamma-HCH on a transect from the Bering Sea to the Greenland Sea in July and August 1994 A fugacity ratio of 1 indicates air-water equilibriumWater/air fugacity ratios (fw/fa) of alpha-HCH and gamma-HCH on a transect from the Bering Sea to the Greenland Sea in July and August 1994 A fugacity ratio of 1 indicates air-water equilibrium |

|
Temporal trends in OC levels (ng/g lw) in reindeer from Abisko, Sweden Levels are usually based on a pool of 10 samplesTemporal trends in OC levels (ng/g lw) in reindeer from Abisko, Sweden Levels are usually based on a pool of 10 samples |

|
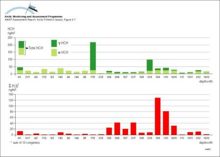
Deposition of PCBs, as mono/di/trichloro- and tetra-nonachlorobiphenyls) in snow cores from the Agassiz Ice Cap (northern Ellesmere Island, Canada) Combined light and dark shaded sections of each bar indicate sum-PCB fluxDeposition of PCBs, as mono/di/trichloro- and tetra-nonachlorobiphenyls) in snow cores from the Agassiz Ice Cap (northern Ellesmere Island, Canada) Combined light and dark shaded sections of each bar [..] |

|
Temporal trends in concentrations of sum-HCH and toxaphene in Arctic airTemporal trends in concentrations of sum-HCH and toxaphene in Arctic air |

|
Temporal trends in PCB and DDT levels (µg/g lw ± 95% confidence limits) of otter muscle in Sweden Levels are based on means of 26, 16, and 28 samples (northern Sweden) and 29, 9, and 15 samples (southern Sweden)Temporal trends in PCB and DDT levels (µg/g lw ± 95% confidence limits) of otter muscle in Sweden Levels are based on means of 26, 16, and 28 samples (northern Sweden) and 29, 9, and 15 samples [..] |

|
Historical profiles of PCBs (trichloro- and all other) in slices from dated sediment cores in Alaska, Canada, and Finland Median age of each slice is given on the vertical axis The green lines indicate the source function of PCBsHistorical profiles of PCBs (trichloro- and all other) in slices from dated sediment cores in Alaska, Canada, and Finland Median age of each slice is given on the vertical axis The green lines [..] |

|
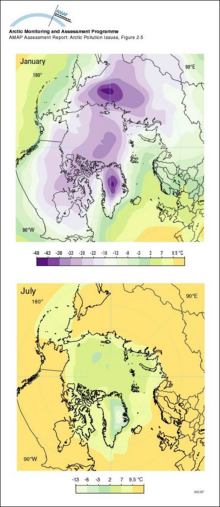
Arctic surface air temperatureMean January and July surface air temperatures (°C) in the Arctic |
|
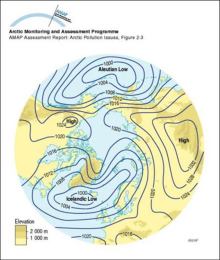
Arctic sea-level atmospheric pressure (January)Mean atmospheric sea-level pressure (mb) in the Arctic in January |
|
Levels of PCB congeners and PCDD/Fs (ng/g lw) in Lake Storvindeln pike muscle between 1968 and 1992Levels of PCB congeners and PCDD/Fs (ng/g lw) in Lake Storvindeln pike muscle between 1968 and 1992 |

|
Temporal trends of sum-PCB and sum-DDT in blubber of female ringed seals from Holman Island in the western Canadian Arctic Vertical bars represent one SDTemporal trends of sum-PCB and sum-DDT in blubber of female ringed seals from Holman Island in the western Canadian Arctic Vertical bars represent one SD |

|
Trends in sum-PCB, sum-DDT, sum-CHL, and toxaphene over a ten year period (20 years for DDT in the Mackenzie Delta) for male narwhal and beluga blubber samples from the Canadian Arctic (N=8-26)Trends in sum-PCB, sum-DDT, sum-CHL, and toxaphene over a ten year period (20 years for DDT in the Mackenzie Delta) for male narwhal and beluga blubber samples from the Canadian Arctic (N=8-26) |

|

water OR waste searches for either of these words
oceans AND biodiversity searches for blocks with both words
pollution NEAR water searches for blocks with either of these words, with them being closer ranks higher
"climate change" searches for this phrase