|
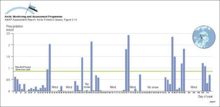
Precipitation rate measurements from Alert from January through April 1992 showing periods of no snow, periods of no snow measured due to wind events, and the relatively large quantities of [..]
|
|
|
Distribution of organochlorine contaminants (OCs) in Arctic air, snow, seawater, and the marine mammals food chain Data for the six major classes of OCs are plotted for each compartment or species as [..]
|

|
|
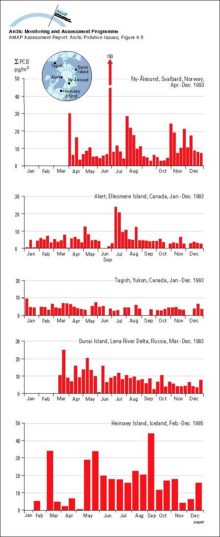
Concentrations of sum-HCH in Arctic air
|

|
|
Source regions for HCH, chlordane, toxaphene, and PCBs in Arctic air based on 5-day back-trajectories for elevated air concentrations at Tagish, Alert, and Ny-Ålesund
|

|
|
Concentrations of sum-PCB in Arctic air (sum of CBs 28, 31, 52, 101, 105, 118, 138, 153, 156, 180)
|
|
|
Flux of HCH and sum-PCB (sum of 10 congeners) in precipitation at Heimaey Island, Iceland
|
|
|
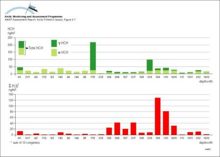
Trends in alpha-HCH and enantiomer ratios (ER) on a transect from the Bering Sea across the polar cap to the Greenland Sea during the Arctic Ocean Transect Study of July and August 1994
|
|
|
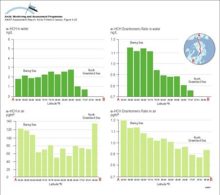
Water/air fugacity ratios (fw/fa) of alpha-HCH and gamma-HCH on a transect from the Bering Sea to the Greenland Sea in July and August 1994 A fugacity ratio of 1 indicates air-water equilibrium
|

|
|
Temporal trends in concentrations of sum-HCH and toxaphene in Arctic air
|

|
|
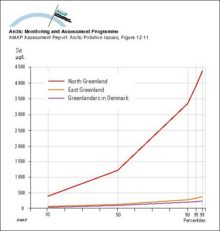
Distribution (in percentiles) of whole blood selenium concentrations in East and North Greenland and in Greenlanders living in Denmark
|
|
|
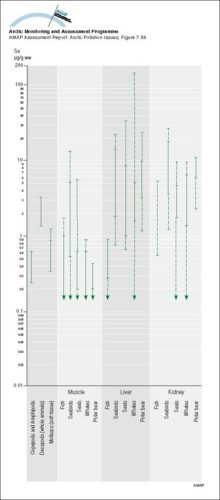
Summary of ranges of Se levels (mean values) in Arctic marine organisms Solid parts of the lines indicate ranges for Greenlandic data
|
|

water OR waste searches for either of these words
oceans AND biodiversity searches for blocks with both words
pollution NEAR water searches for blocks with either of these words, with them being closer ranks higher
"climate change" searches for this phrase