|
MAGIC model results for the streamwater at Dalelva for the past 90 years and for three future scenarios assuming a 0%, 70%, and 95% reduction of the present sulfur deposition levels
|

|
|
(a) Trajectories of five satellite-tracked buoys launched in Mackenzie Bay, Canada, and (b) results of 30-day trajectories of oil launched from five hypothetical spill locations in the Beaufort Sea
|

|
|
Model evaluation comparing a five-day model simulation with results of an oil release experiment in the marginal ice zone near Svalbard in April 1993
|

|
|
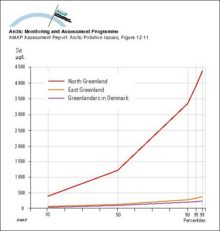
Distribution (in percentiles) of whole blood selenium concentrations in East and North Greenland and in Greenlanders living in Denmark
|
|
|
A schematic of the three-level thermodynamic snow ice system model
|

|
|
Distribution of radioactivity (PCi/L) in the surface layer of the ocean after ten years of simulation of Preller's model Source locations are the Ob, Yenisey and Pechora Rivers, as well as Sellafield
|
|
|
Yearly and depth-averaged concentrations (Bq/m3) of 137Cs after 6 years from Harms' model The sources are instantaneous releases of 1 PBq from the dump sites in Abrosimov Bay, Stepovogo Bay, Tsivolky [..]
|
|
|
Vertically integrated tracer burden shown after 15 years Units are burden per unit surface area, normalized by cumulative release Bottom topography is in meters; a) no neptune, centered difference, [..]
|
|
|
Tracer concentration on a vertical section (along Y=0 on Figure 346) after 15 years; a) no neptune, centered difference; b) neptune, flux-corrected transport; c,d) velocity normal to the section with [..]
|
|

water OR waste searches for either of these words
oceans AND biodiversity searches for blocks with both words
pollution NEAR water searches for blocks with either of these words, with them being closer ranks higher
"climate change" searches for this phrase