|
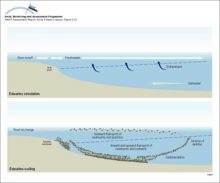
Illustration of water, sediment and nutrient cycling in estuaries Freshwater flows outward, transporting sediments, plankton and also contaminants Material that sinks into the inflowing seawater may [..]
|
|
|
Historical profiles of PCBs (trichloro- and all other) in slices from dated sediment cores in Alaska, Canada, and Finland Median age of each slice is given on the vertical axis The green lines [..]
|

|
|
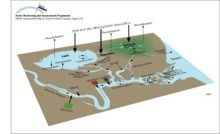
Conceptual model of the terrestrial/freshwater compartment showing the main subcompartments and contaminant transfers, and exchanges with the atmosphere and oceans
|
|
|
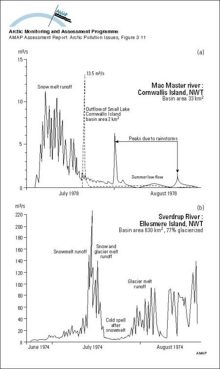
Hydrographs showing two types of streamflow regimes for Arctic rivers: a) Arctic nival regime and b) proglacial regime
|
|
|
a) The annual (1973-1990) and mean annual hydrographs for the Mackenzie River above the Arctic Red River, NWT, Canada, indicating the dominance of the spring freshet in May
|
|
|
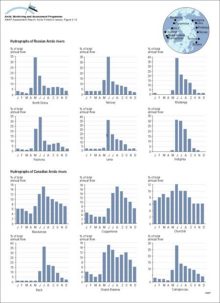
Monthly mean discharge expressed as a percent of annual discharge from available data for selected Russian and Canadian rivers draining to the Arctic
|
|
|
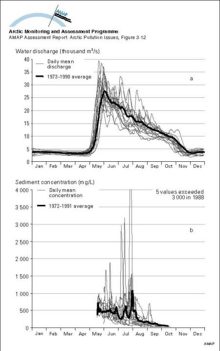
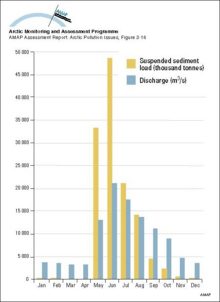
Comparison of monthly water and suspended sediment loads to the Mackenzie Delta plain for the period 1974-1983
|
|
|
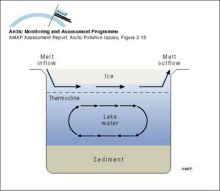
Illustration of the movement of less dense spring freshet water moving through a small Arctic lake underneath the surface ice cover, but not mixing with the water column
|
|
|
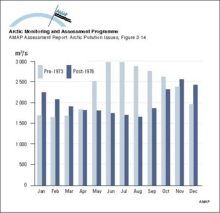
Monthly mean discharges for the Nelson River, Canada for the period 1960 to regulation in 1973, compared to post-regulation discharges from 1976 to 1990
|
|
|
Concentrations, as geometric means, of major organochlorine groups in burbot liver at Fort Good Hope, NWT, Canada (1986-94) Vertical bars denote standard errors
|

|
|
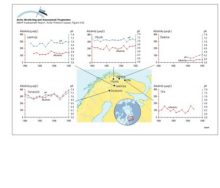
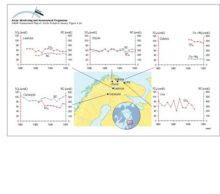
Annual average of alkalinity and pH as measured in rivers in northern Fennoscandia and the Kola Peninsula
|
|
|
Annual average of sulfate and base cation concentrations as measured in rivers in northern Fennoscandia and the Kola Peninsula Note: SO4 (non-seasalt) estimated for river Utsjoki from total sulfur
|
|
|
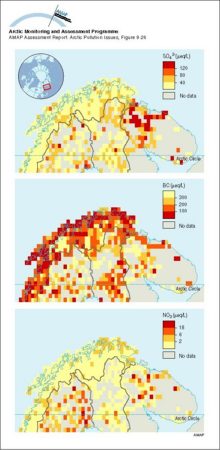
Median concentrations of sulfate, base cations, and nitrate in lakes of northern Fennoscandia and the Kola Peninsula
|
|
|
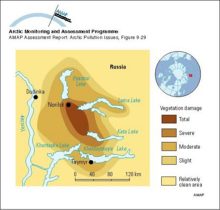
Vegetation damage zones around Norilsk
|
|
|
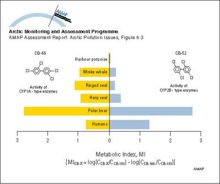
Cytochrome P450 1A (CYP1A) and cytochrome P4502B (CYP2B) type enzyme activities in some Arctic marine mammals and humans using the metabolic index (MI) suggested by Tanabe et al 1994a
|
|

water OR waste searches for either of these words
oceans AND biodiversity searches for blocks with both words
pollution NEAR water searches for blocks with either of these words, with them being closer ranks higher
"climate change" searches for this phrase