|
Comparison of sum-PCB concentrations (lipid normalized) in Arctic versus temperate zone salmonid fish See Annex Table 6A9 for wet weight concentrations
|
|
|
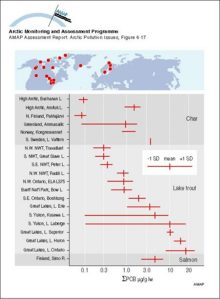
OC levels (µg/g lw in muscle) in landlocked and anadromous (italic labels) Arctic char
|
|
|
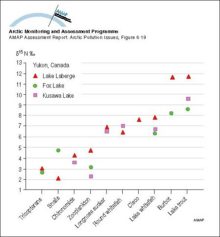
Mean delta-15 nitrogen (ppt) for invertebrates and fish collected from Laberge, Fox, and Kusawa Lakes
|
|
|
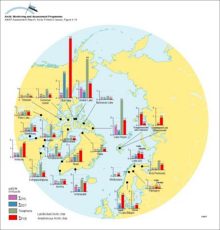
Geographic trends of sum-PCBs in zooplankton (>100 µm) in northern Canadian lakes All concentrations in ng/g dw
|
|
|
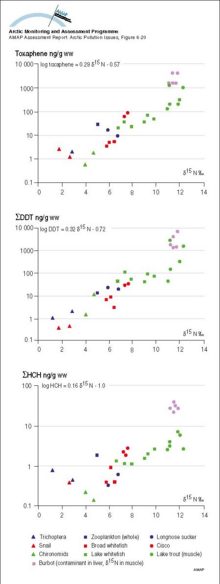
delta-15 Nitrogen isotope ratios versus Toxaphene, DDT, and HCH for fish and invertebrates from Lake Laberge, Yukon Territory
|
|
|
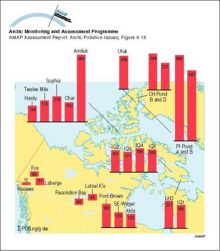
Historical profiles of PCBs (trichloro- and all other) in slices from dated sediment cores in Alaska, Canada, and Finland Median age of each slice is given on the vertical axis The green lines [..]
|

|
|
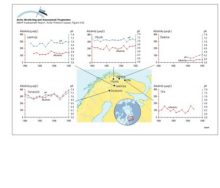
Annual average of alkalinity and pH as measured in rivers in northern Fennoscandia and the Kola Peninsula
|
|
|
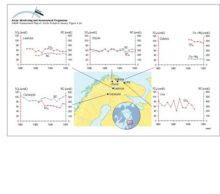
Annual average of sulfate and base cation concentrations as measured in rivers in northern Fennoscandia and the Kola Peninsula Note: SO4 (non-seasalt) estimated for river Utsjoki from total sulfur
|
|
|
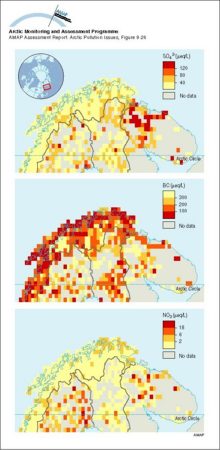
Median concentrations of sulfate, base cations, and nitrate in lakes of northern Fennoscandia and the Kola Peninsula
|
|
|
SMART model results for selected soil and lake output variables at Christmas lakes for the past 90 years and for three future scenarios assuming a 0%, 70% and 95% reduction of the present sulfur [..]
|

|
|
MAGIC model results for the streamwater at Dalelva for the past 90 years and for three future scenarios assuming a 0%, 70%, and 95% reduction of the present sulfur deposition levels
|

|
|
(a) Critical loads of acidity expressed as sulfur (5th percentile presented for each grid) for lakes in northern Fennoscandia and surface waters on Svalbard, and (b) their exceedance (95th percentile)
|

|
|
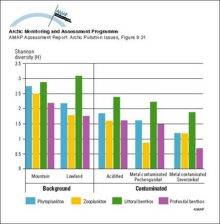
Diversity indices (Shannon-Weaver means) for phytoplankton, zooplankton and zoobenthos in lakes and streams in the Murmansk region
|
|
|
Concentrations, as geometric means, of major organochlorine groups in burbot liver at Fort Good Hope, NWT, Canada (1986-94) Vertical bars denote standard errors
|

|
|
Temporal trends in levels of PCB, DDT, alpha-HCH, and HCB in muscle from Lake Storvindeln pike and Lake Abiskojaure char in Sweden Mean levels (µg/g lw) and 95% confidence intervals of the mean are [..]
|

|

water OR waste searches for either of these words
oceans AND biodiversity searches for blocks with both words
pollution NEAR water searches for blocks with either of these words, with them being closer ranks higher
"climate change" searches for this phrase