|
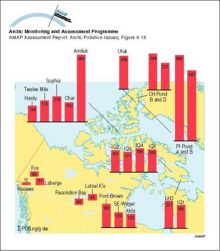
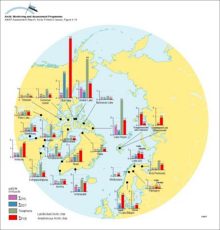
Geographic trends of sum-PCBs in zooplankton (>100 µm) in northern Canadian lakes All concentrations in ng/g dw
|
|
|
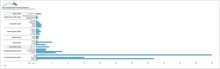
Relative tissue concentrations of organochlorine compounds detected in lichen, and in adipose tissue of caribou and wolf at three locations in the Northwest Territories, Canada
|

|
|
Observed and predicted organochlorine concentrations (ng/g ww) in caribou and reindeer (Rangifer tarandus) liver All data are presented in, or were derived from data in Annex Table 6A4
|
|
|
Average concentrations (ng/L) of sum-HCH in Arctic rivers in 1993
|
|
|
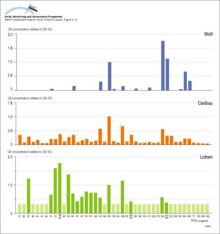
Concentrations of PCB congeners relative to PCB congener 153 for lichen, caribou, and wolf in the Bathurst herd, Canada The light bars denote that the congener was not detected
|
|
|
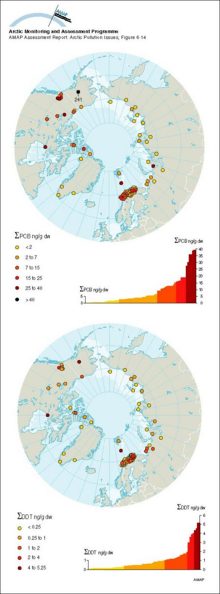
Concentrations of sum-PCB and sum-DDT in surface sediments (from grab samples or from top slices of cores) on a circumpolar basis, and the ranked distribution of values
|
|
|
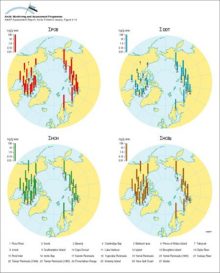
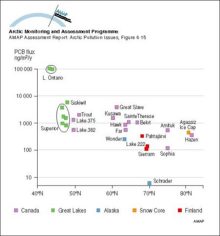
Latitudinal fluxes of sum-PCB in dated sediment cores from 25 locations including 13 Arctic locations (in Canada, Finland, and Alaska)
|
|
|
Comparison of sum-PCB concentrations (lipid normalized) in Arctic versus temperate zone salmonid fish See Annex Table 6A9 for wet weight concentrations
|
|
|
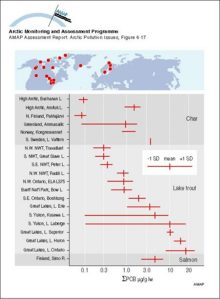
OC levels (µg/g lw in muscle) in landlocked and anadromous (italic labels) Arctic char
|
|
|
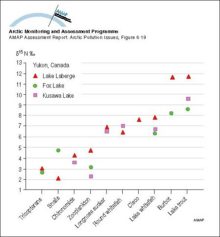
Mean delta-15 nitrogen (ppt) for invertebrates and fish collected from Laberge, Fox, and Kusawa Lakes
|
|
|
Temporal trends in concentrations of sum-HCH and toxaphene in Arctic air
|

|
|
Temporal trends in PCB and DDT levels (µg/g lw ± 95% confidence limits) of otter muscle in Sweden Levels are based on means of 26, 16, and 28 samples (northern Sweden) and 29, 9, and 15 samples [..]
|

|
|
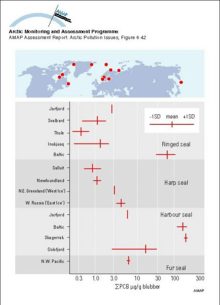
Comparison of sum-PCB concentrations in seal blubber from various Arctic regions with results from the same species in temperate waters Vertical bars represent means and the horizontal bars the [..]
|
|
|
Temporal trends in OC levels (ng/g lw) in reindeer from Abisko, Sweden Levels are usually based on a pool of 10 samples
|

|
|
Concentrations, as geometric means, of major organochlorine groups in burbot liver at Fort Good Hope, NWT, Canada (1986-94) Vertical bars denote standard errors
|

|

water OR waste searches for either of these words
oceans AND biodiversity searches for blocks with both words
pollution NEAR water searches for blocks with either of these words, with them being closer ranks higher
"climate change" searches for this phrase