Your query returned 97 graphics.
Results 91 - 97
|
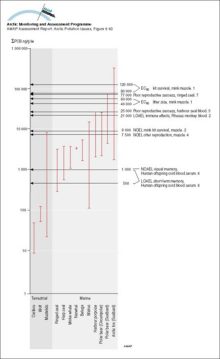
Sum-PCB (ng/g lw) in Arctic mammals compared to thresholds for mammalian effects (1 Leonards et al 1995, 2 Tryphonas 1994, 3 Kihlström et al 1992, 4 Olsson et al 1996a, 5 Boon et al 1987, 6 Ahlborg et [..]
|
|
|
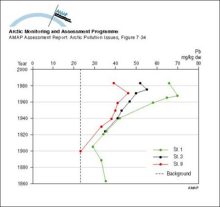
Lead in sediments near the cryolite mine at Ivittuut, south Greenland Stations 1, 3 and 9 are located at distances of 800 m, 1600 m and 5600 m, respectively, from the mine
|
|
|
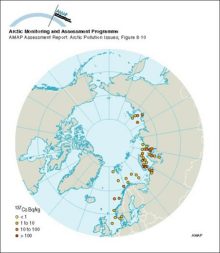
Average 137Cs activity concentrations in surface sediments of some Arctic seas sampled from 1992 to 1995
|
|
|
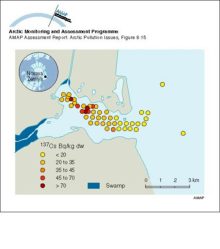
Activity concentrations of 137Cs in sediments of Abrosimov Bay
|
|
|
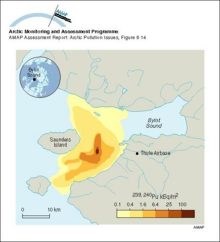
Activity concentrations of 239,240Pu in sediments near Thule, Greenland
|
|
|
Average annual maximum and minimum sea ice extent The numbered lines show the expected time in years for the ice at that location to exit the Arctic Ocean through the Fram Strait, based on drifting [..]
|

|
|
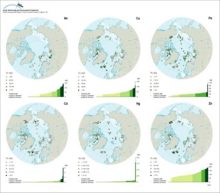
Concentrations of metals in fine-grained surface marine sediments in the Arctic
|
|

water OR waste searches for either of these words
oceans AND biodiversity searches for blocks with both words
pollution NEAR water searches for blocks with either of these words, with them being closer ranks higher
"climate change" searches for this phrase