|
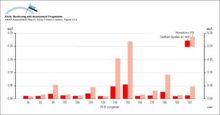
Concentrations of PCB congeners in cord plasma from Nunavik and southern Quebec newborns
|
|
|
Body burdens of radiocaesium (yearly averages) across the Canadian Arctic
|

|
|
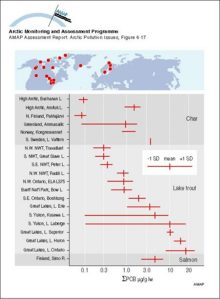
Comparison of sum-PCB concentrations (lipid normalized) in Arctic versus temperate zone salmonid fish See Annex Table 6A9 for wet weight concentrations
|
|
|
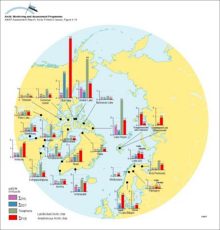
OC levels (µg/g lw in muscle) in landlocked and anadromous (italic labels) Arctic char
|
|
|
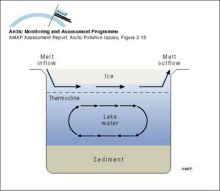
Illustration of the movement of less dense spring freshet water moving through a small Arctic lake underneath the surface ice cover, but not mixing with the water column
|
|
|
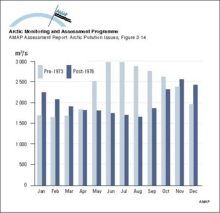
Monthly mean discharges for the Nelson River, Canada for the period 1960 to regulation in 1973, compared to post-regulation discharges from 1976 to 1990
|
|
|
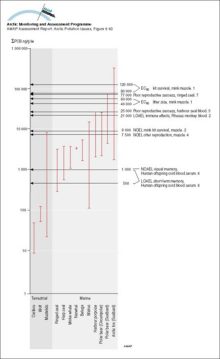
Sum-PCB (ng/g lw) in Arctic mammals compared to thresholds for mammalian effects (1 Leonards et al 1995, 2 Tryphonas 1994, 3 Kihlström et al 1992, 4 Olsson et al 1996a, 5 Boon et al 1987, 6 Ahlborg et [..]
|
|
|
Organochlorine levels in polar bear adipose tissues (µg/g lw), adjusted to levels expected in 11-year-old males (after correction for age and sex), for sum-PCB, sum-CHL, sum-HCH, and sum-CBz, and in [..]
|
|
|
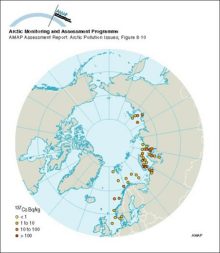
Average 137Cs activity concentrations in surface sediments of some Arctic seas sampled from 1992 to 1995
|
|
|
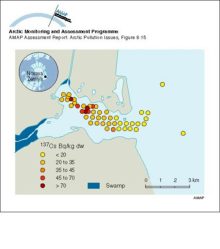
Activity concentrations of 137Cs in sediments of Abrosimov Bay
|
|
|
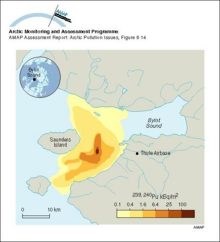
Activity concentrations of 239,240Pu in sediments near Thule, Greenland
|
|
|
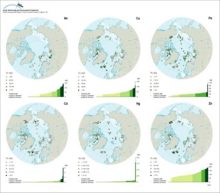
Concentrations of metals in fine-grained surface marine sediments in the Arctic
|
|
|
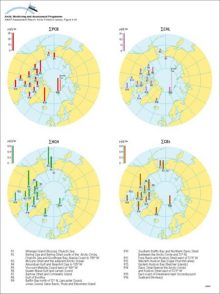
Average annual maximum and minimum sea ice extent The numbered lines show the expected time in years for the ice at that location to exit the Arctic Ocean through the Fram Strait, based on drifting [..]
|

|

water OR waste searches for either of these words
oceans AND biodiversity searches for blocks with both words
pollution NEAR water searches for blocks with either of these words, with them being closer ranks higher
"climate change" searches for this phrase