Your query returned 179 graphics.
Results 31 - 45
Spatial distribution of global emissions of Hg in 1990 within a 1° x 1° grid The total emission inventory is 2144 tonnes HgSpatial distribution of global emissions of Hg in 1990 within a 1° x 1° grid The total emission inventory is 2144 tonnes Hg |

|
Contributions from different continents and from different sources to the global emissions of Hg to the atmosphereContributions from different continents and from different sources to the global emissions of Hg to the atmosphere |

|
Spatial distribution of emissions of Pb within the 150 km x 150 km EMEP grid system for the area north of latitude 50° N in 1989Spatial distribution of emissions of Pb within the 150 km x 150 km EMEP grid system for the area north of latitude 50° N in 1989 |

|
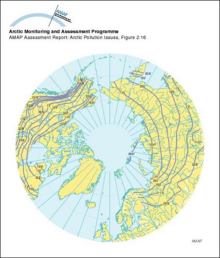
River break-up in the ArcticMean dates of river break-up in the Arctic; month number in Roman numerals |
|
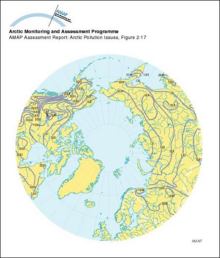
River freeze-up in the ArcticMean dates of river freeze-up in the Arctic |
|
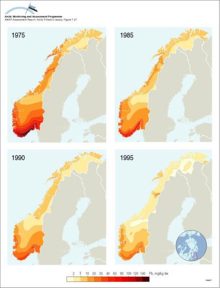
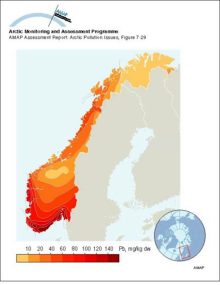
Latitudinal gradient of deposition of Pb in Norway in different years, as reflected by Pb concentrations in mossLatitudinal gradient of deposition of Pb in Norway in different years, as reflected by Pb concentrations in moss |
|
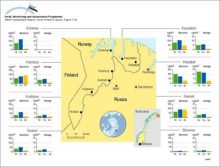
Average (15-month) and 24-h average maximum air concentrations of Ni, Cu and As measured at several stations in northern Norway near to major point sources on the Kola PeninsulaAverage (15-month) and 24-h average maximum air concentrations of Ni, Cu and As measured at several stations in northern Norway near to major point sources on the Kola Peninsula |
|
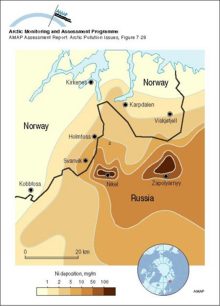
Nickel deposition to snow on the Kola Peninsula in April 1990Nickel deposition to snow on the Kola Peninsula in April 1990 |
|
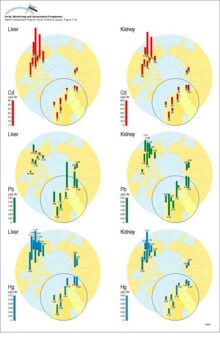
Circumpolar distribution of Cd, Pb and Hg levels in liver and kidney tissue of willow ptarmigan (Lagopus lagopus)Circumpolar distribution of Cd, Pb and Hg levels in liver and kidney tissue of willow ptarmigan (Lagopus lagopus) |
|
Lead concentrations in soil in Norway in 1975Lead concentrations in soil in Norway in 1975 |
|
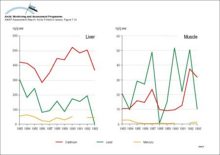
Changes with time in concentrations of Cd, Pb and Hg in liver and muscle tissue of reindeer (Rangifer tarandus) sampled in three districts in eastern SwedenChanges with time in concentrations of Cd, Pb and Hg in liver and muscle tissue of reindeer (Rangifer tarandus) sampled in three districts in eastern Sweden |
|
Composition of particles measured at different altitudes during winter flights in the Norwegian ArcticComposition of particles measured at different altitudes during winter flights in the Norwegian Arctic |

|
Concentrations of As and V in aerosols measured during concurrent measurement campaigns on Svalbard and two locations in Alaska during April 1986Concentrations of As and V in aerosols measured during concurrent measurement campaigns on Svalbard and two locations in Alaska during April 1986 |
|
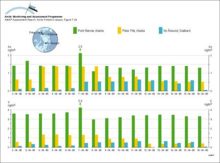
The ten major point sources, and their emissions of As and Cd to the atmosphere, in Europe at the beginning of the 1990s Numbers above the columns are emissions in tonnes per yearThe ten major point sources, and their emissions of As and Cd to the atmosphere, in Europe at the beginning of the 1990s Numbers above the columns are emissions in tonnes per year |

|
Changes with time in European atmospheric emissions of Cd, Pb and ZnChanges with time in European atmospheric emissions of Cd, Pb and Zn |

|

water OR waste searches for either of these words
oceans AND biodiversity searches for blocks with both words
pollution NEAR water searches for blocks with either of these words, with them being closer ranks higher
"climate change" searches for this phrase