|
Temporal variation in calculated reindeer Tag values for different Arctic regions
|

|
|
Spatial trends in the net flux from reindeer meat in different Arctic areas, for the first year after an assumed uniform deposition of 100 kBq/m2
|

|
|
Temporal variation in cow milk Tag values for Sweden, Norway and Finland
|

|
|
Comparison of the predicted flux of 137Cs in milk and reindeer meat in different Arctic areas, for the first year after an assumed uniform deposition of 100 kBq/m2
|

|
|
(a) Vertical distribution of SOx (SO2 + SO42-) concentrations averaged over the area north of 75°N, and (b) contributions from the different sources
|

|
|
Summer and winter visibility observations (for relative humidities less than 80%) for the period 1951 to 1993 in North America
|

|
|
(a) The contribution from the different sources to the total deposition, averaged over the area north of 75°N from October 1990 to May 1994, (b) the calculated total monthly depositions of SOx [..]
|

|
|
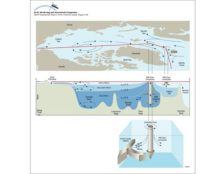
(a) Trajectories of five satellite-tracked buoys launched in Mackenzie Bay, Canada, and (b) results of 30-day trajectories of oil launched from five hypothetical spill locations in the Beaufort Sea
|

|
|
Sequence of oil-ice interaction including drops under the ice, new ice growth below the oil, oil appearing on the surface in the spring, wind herding of oil on melt pools, and the appearance of [..]
|
|
|
Model evaluation comparing a five-day model simulation with results of an oil release experiment in the marginal ice zone near Svalbard in April 1993
|

|
|
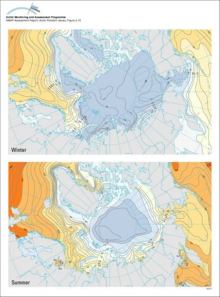
Winter and summer surface water temperatures (°C) in the Arctic Ocean and adjacent seas
|
|
|
Winter and summer surface water salinity in the Arctic Ocean and adjacent seas
|

|
|
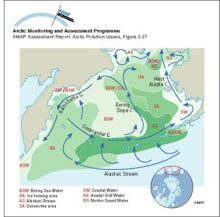
Schematic diagram of circulation and the extent of different water masses in the Bering Sea
|
|
|
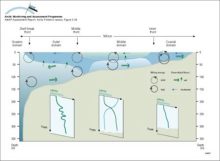
The different domains of the Bering Sea continental shelf are separated by fronts The coastal domain (depth <50m) tends to be vertically homogeneous, the middle domain (50-100m) shows a clear [..]
|
|
|
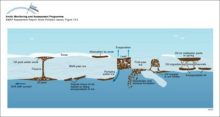
Circulation and water mass structure in the Arctic Ocean and Nordic Seas Mixing processes, such as brine formation, result in denser water that is transported off the shelves and into the deep basin
|
|

water OR waste searches for either of these words
oceans AND biodiversity searches for blocks with both words
pollution NEAR water searches for blocks with either of these words, with them being closer ranks higher
"climate change" searches for this phrase