Your query returned 147 graphics.
Results 106 - 120
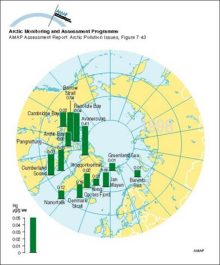
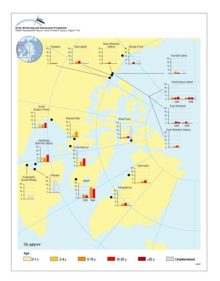
Circumpolar distribution of Hg levels in muscle tissue of Arctic cod (Boreogadus saida) Arithmetic mean concentrationsCircumpolar distribution of Hg levels in muscle tissue of Arctic cod (Boreogadus saida) Arithmetic mean concentrations |
|
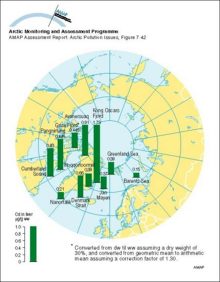
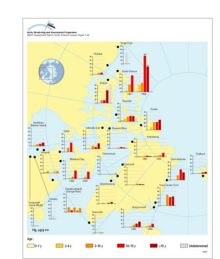
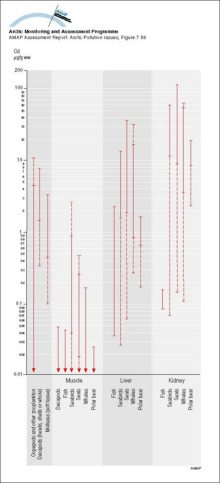
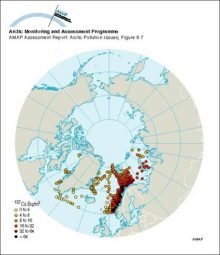
Circumpolar distribution of Cd levels in liver tissue of Arctic cod (Boreogadus saida) Arithmetic mean concentrationsCircumpolar distribution of Cd levels in liver tissue of Arctic cod (Boreogadus saida) Arithmetic mean concentrations |
|
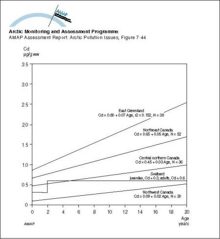
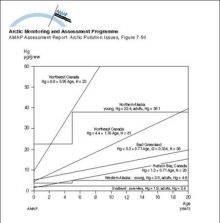
Age accumulation of Cd in liver of polar bears from different Arctic regionsAge accumulation of Cd in liver of polar bears from different Arctic regions |
|
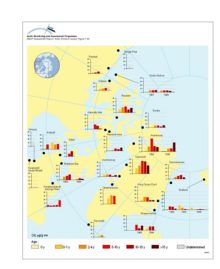
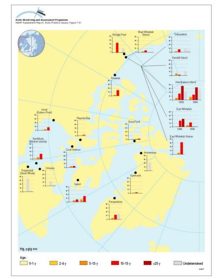
Distribution of Cd levels in liver tissue of ringed seal (Phoca hispida) of different ages Plots show selected data (geometric mean values) from Annex Table 7A15Distribution of Cd levels in liver tissue of ringed seal (Phoca hispida) of different ages Plots show selected data (geometric mean values) from Annex Table 7A15 |
|
Distribution of Cd levels in liver tissue of beluga whale (Delphinapterus leucas) of different ages Plots show selected data (geometric mean values) from Annex Table 7A15Distribution of Cd levels in liver tissue of beluga whale (Delphinapterus leucas) of different ages Plots show selected data (geometric mean values) from Annex Table 7A15 |
|
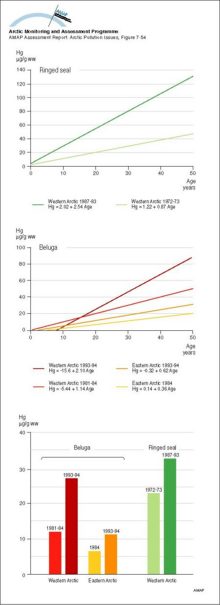
Distribution of Hg levels in liver tissue of ringed seal (Phoca hispida) of different ages Plots show selected data (geometric mean values) from Annex Table 7A15Distribution of Hg levels in liver tissue of ringed seal (Phoca hispida) of different ages Plots show selected data (geometric mean values) from Annex Table 7A15 |
|
Age accumulation of Hg in liver of polar bears from different Arctic regionsAge accumulation of Hg in liver of polar bears from different Arctic regions |
|
Distribution of Hg levels in liver tissue of beluga whale (Delphinapterus leucas) of different ages (years) Plots show selected data (geometric mean values) from Annex Table 7A15Distribution of Hg levels in liver tissue of beluga whale (Delphinapterus leucas) of different ages (years) Plots show selected data (geometric mean values) from Annex Table 7A15 |
|
Age accumulation and temporal comparison of mean concentrations of Hg in liver tissue of ringed seal (Phoca hispida) and beluga whale (Delphinapterus leucas) fron the Canadian ArcticAge accumulation and temporal comparison of mean concentrations of Hg in liver tissue of ringed seal (Phoca hispida) and beluga whale (Delphinapterus leucas) fron the Canadian Arctic |
|
Summary of ranges of Cd levels (mean values) in Arctic marine organisms Solid parts of the lines indicate ranges for Greenlandic dataSummary of ranges of Cd levels (mean values) in Arctic marine organisms Solid parts of the lines indicate ranges for Greenlandic data |
|
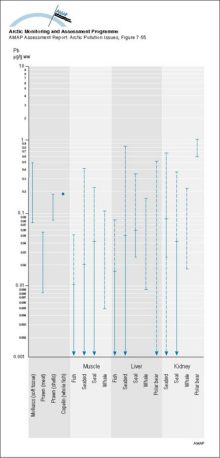
Summary of ranges of Pb levels (mean values) in Arctic marine organisms Solid parts of the lines indicate ranges for Greenlandic dataSummary of ranges of Pb levels (mean values) in Arctic marine organisms Solid parts of the lines indicate ranges for Greenlandic data |
|
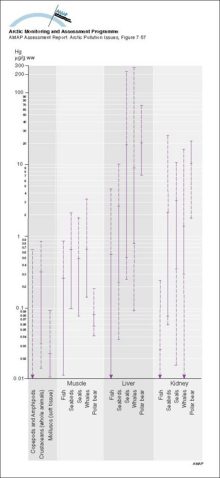
Summary of ranges of Hg levels (mean values) in Arctic marine organisms Solid parts of the lines indicate ranges for Greenlandic dataSummary of ranges of Hg levels (mean values) in Arctic marine organisms Solid parts of the lines indicate ranges for Greenlandic data |
|
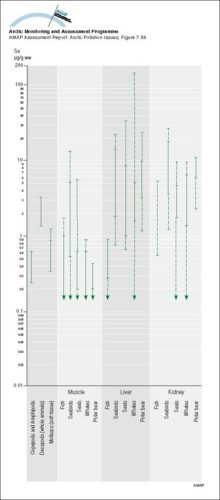
Summary of ranges of Se levels (mean values) in Arctic marine organisms Solid parts of the lines indicate ranges for Greenlandic dataSummary of ranges of Se levels (mean values) in Arctic marine organisms Solid parts of the lines indicate ranges for Greenlandic data |
|
Cs-137 activity concentrations in surface seawater in 1979 and 1982Cs-137 activity concentrations in surface seawater in 1979 and 1982 |
|
Seawater concentrations of 137Cs in the Barents and East Greenland Seas compared to the yearly releases from SellafieldSeawater concentrations of 137Cs in the Barents and East Greenland Seas compared to the yearly releases from Sellafield |

|

water OR waste searches for either of these words
oceans AND biodiversity searches for blocks with both words
pollution NEAR water searches for blocks with either of these words, with them being closer ranks higher
"climate change" searches for this phrase