|
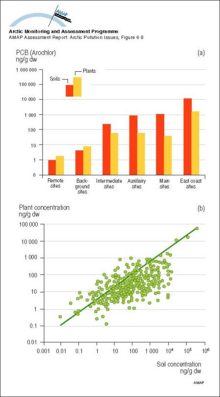
Concentrations of Aroclor PCBs in soils and plants (ng/g dw) associated with military radar sites in the Canadian Arctic a) Mean and maximum total PCB concentrations in soils and associated plants [..]
|
|
|
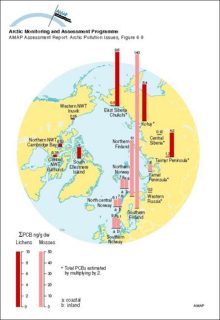
Average concentration (ng/g dw) of PCBs in Arctic lichen and mosses
|
|
|
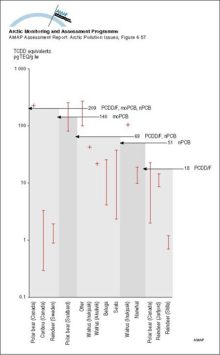
Body concentrations of PCDD/F and non-ortho and mono-ortho PCBs as TCDD equivalents (pg/g lw) in Arctic mammals compared to thresholds for immunosuppression in harbor seal for the same combinations of [..]
|
|
|
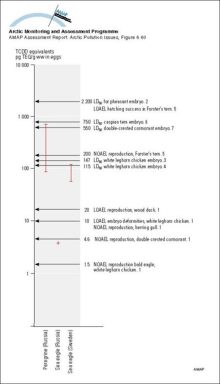
Concentrations of PCDD/F and non-ortho and mono-ortho PCBs as TCDD equivalents (pg/g ww) in Arctic bird eggs compared to thresholds for avian effects (1 Giesy et al 1994b, 2 Nosek et al 1992, 3 [..]
|
|
|
Deposition of PCBs, as mono/di/trichloro- and tetra-nonachlorobiphenyls) in snow cores from the Agassiz Ice Cap (northern Ellesmere Island, Canada) Combined light and dark shaded sections of each bar [..]
|

|
|
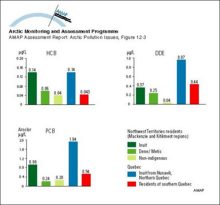
Geometric mean levels of HCB, DDE and PCBs in cord blood of newborns in different Canadian population groups
|
|
|
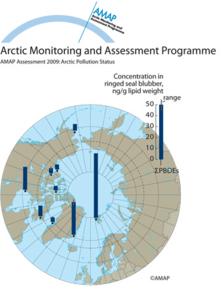
PBDEs in ringed seals
|
|
|
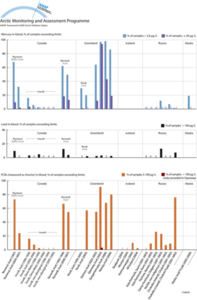
Exceedance of blood guideline values for mercury, lead and PCBs in mothers and women of child-bearing age in different populations in Canada, Greenland, Iceland, Russia and the United States (Alaska)
|
|
|
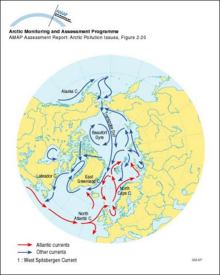
Surface ocean currents in the Arctic
|
|
|
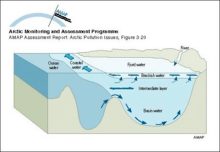
Conceptual model of the coastal zone and marine environments showing the main subcompartments and contaminant transfers, and exchanges with the atmosphere
|

|
|
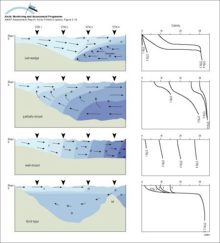
Basic circulation and salinity distribution in salt wedge, partially-mixed, well-mixed and fjord-type estuaries as defined by Wollast and Duinker (1982) Numbers and shading show salinity values
|
|
|
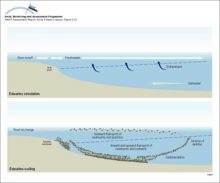
Sketch of main circulation pattern in a fjord
|
|
|
Illustration of water, sediment and nutrient cycling in estuaries Freshwater flows outward, transporting sediments, plankton and also contaminants Material that sinks into the inflowing seawater may [..]
|
|
|
Schematic representation of shelf processes involving transport of contaminants and sea ice
|

|
|
Average annual maximum and minimum sea ice extent The numbered lines show the expected time in years for the ice at that location to exit the Arctic Ocean through the Fram Strait, based on drifting [..]
|

|

water OR waste searches for either of these words
oceans AND biodiversity searches for blocks with both words
pollution NEAR water searches for blocks with either of these words, with them being closer ranks higher
"climate change" searches for this phrase