Your query returned 120 graphics.
Results 76 - 90
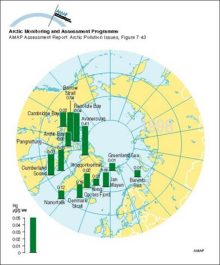
Circumpolar distribution of Hg levels in muscle tissue of Arctic cod (Boreogadus saida) Arithmetic mean concentrationsCircumpolar distribution of Hg levels in muscle tissue of Arctic cod (Boreogadus saida) Arithmetic mean concentrations |
|
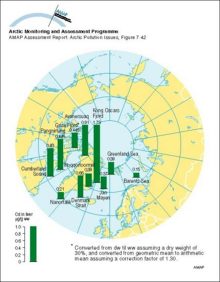
Circumpolar distribution of Cd levels in liver tissue of Arctic cod (Boreogadus saida) Arithmetic mean concentrationsCircumpolar distribution of Cd levels in liver tissue of Arctic cod (Boreogadus saida) Arithmetic mean concentrations |
|
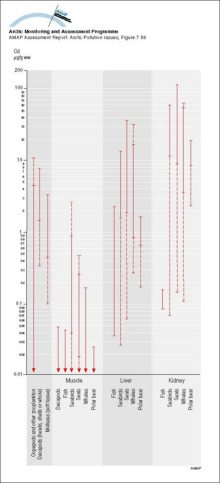
Summary of ranges of Cd levels (mean values) in Arctic marine organisms Solid parts of the lines indicate ranges for Greenlandic dataSummary of ranges of Cd levels (mean values) in Arctic marine organisms Solid parts of the lines indicate ranges for Greenlandic data |
|
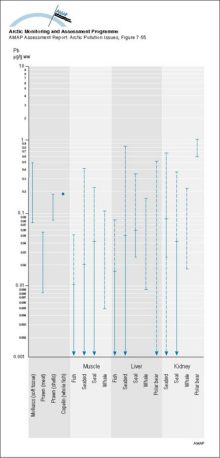
Summary of ranges of Pb levels (mean values) in Arctic marine organisms Solid parts of the lines indicate ranges for Greenlandic dataSummary of ranges of Pb levels (mean values) in Arctic marine organisms Solid parts of the lines indicate ranges for Greenlandic data |
|
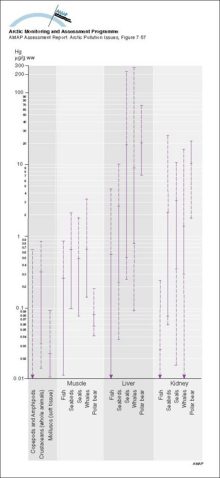
Summary of ranges of Hg levels (mean values) in Arctic marine organisms Solid parts of the lines indicate ranges for Greenlandic dataSummary of ranges of Hg levels (mean values) in Arctic marine organisms Solid parts of the lines indicate ranges for Greenlandic data |
|
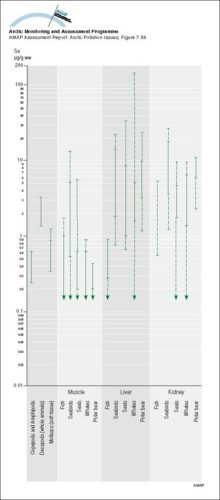
Summary of ranges of Se levels (mean values) in Arctic marine organisms Solid parts of the lines indicate ranges for Greenlandic dataSummary of ranges of Se levels (mean values) in Arctic marine organisms Solid parts of the lines indicate ranges for Greenlandic data |
|
Concentrations of sum-DDT and sum-PCB in marine surface sediments (from grab samples or from top slices of cores) on a circumpolar basis, and the ranked distribution of valuesConcentrations of sum-DDT and sum-PCB in marine surface sediments (from grab samples or from top slices of cores) on a circumpolar basis, and the ranked distribution of values |
|
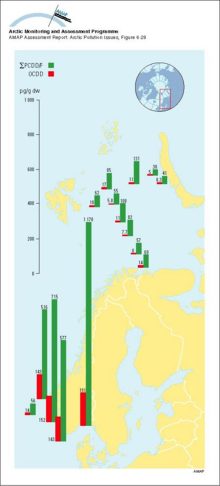
Concentration (pg/g dw) profiles for octachlorodioxin (OCDD) and total PCDD/Fs in marine sediments from southern and western Norwegian waters and from the Barents SeaConcentration (pg/g dw) profiles for octachlorodioxin (OCDD) and total PCDD/Fs in marine sediments from southern and western Norwegian waters and from the Barents Sea |
|
Concentrations of sum-HCH and HCB in marine surface sediments (from grab samples or from top slices of cores) on a circumpolar basis, and the ranked distribution of valuesConcentrations of sum-HCH and HCB in marine surface sediments (from grab samples or from top slices of cores) on a circumpolar basis, and the ranked distribution of values |
|
Water/air fugacity ratios (fw/fa) of alpha-HCH and gamma-HCH on a transect from the Bering Sea to the Greenland Sea in July and August 1994 A fugacity ratio of 1 indicates air-water equilibriumWater/air fugacity ratios (fw/fa) of alpha-HCH and gamma-HCH on a transect from the Bering Sea to the Greenland Sea in July and August 1994 A fugacity ratio of 1 indicates air-water equilibrium |

|
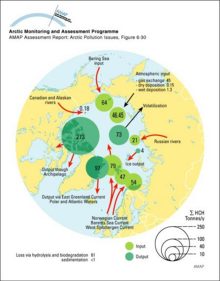
Sum-HCH budget for the Arctic Ocean (tonnes/y)Sum-HCH budget for the Arctic Ocean (tonnes/y) |
|
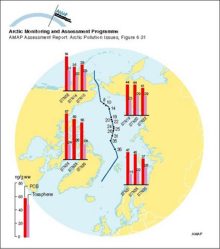
Sum-PCB and sum-DDT (ng/g lw) in Arctic cod liver, 1994-95Sum-PCB and sum-DDT (ng/g lw) in Arctic cod liver, 1994-95 |
|
PCB and toxaphene (ng/g ww) in zooplankton from the transpolar cruise of the Arctic Ocean, July-September 1994PCB and toxaphene (ng/g ww) in zooplankton from the transpolar cruise of the Arctic Ocean, July-September 1994 |
|
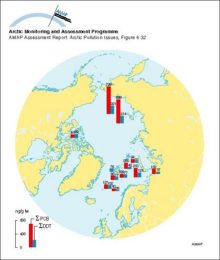
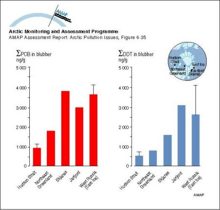
Geographical trends of PCB and DDT in harp seals from Arctic waters Vertical bars represent arithmetic means ± SD of combined results for males and females The SD has been estimated from the range in some casesGeographical trends of PCB and DDT in harp seals from Arctic waters Vertical bars represent arithmetic means ± SD of combined results for males and females The SD has been estimated from the range in [..] |
|
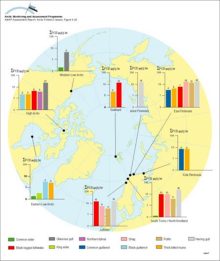
Levels of PCBs in seabird eggs (µg/g lw) Values written above bars are actual mean concentrations Wet weight means are given in Annex Table 6A16Levels of PCBs in seabird eggs (µg/g lw) Values written above bars are actual mean concentrations Wet weight means are given in Annex Table 6A16 |
|

water OR waste searches for either of these words
oceans AND biodiversity searches for blocks with both words
pollution NEAR water searches for blocks with either of these words, with them being closer ranks higher
"climate change" searches for this phrase