|
Predicted release rates of different radionuclide groups from the submarine reactor dumped in the Novaya Zemlya Trough (best estimate scenario)
|

|
|
Locations of sea dumping of radioactive waste in the Russian Arctic
|

|
|
Dose estimates based on wholebody measurements (see Figure 836) for two groups (northern Saami and southern Saami) of Norwegian reindeer-breeding Saami
|

|
|
Changes with time in 137Cs contamination in the food chain lichen - reindeer - humans
|

|
|
Temporal variation in calculated reindeer Tag values for different Arctic regions
|

|
|
Temporal variation in cow milk Tag values for Sweden, Norway and Finland
|

|
|
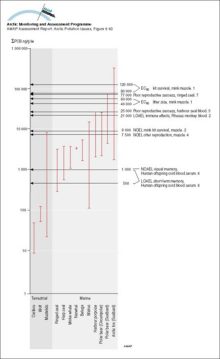
Sum-PCB (ng/g lw) in Arctic mammals compared to thresholds for mammalian effects (1 Leonards et al 1995, 2 Tryphonas 1994, 3 Kihlström et al 1992, 4 Olsson et al 1996a, 5 Boon et al 1987, 6 Ahlborg et [..]
|
|
|
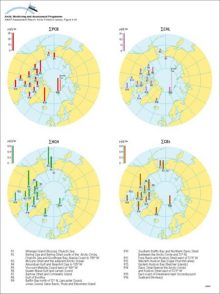
Concentration (pg/g dw) profiles for octachlorodioxin (OCDD) and total PCDD/Fs in dated sediment cores from Arctic Canada and Finland Sum-PCDD/Fs = sum of 2,3,7,8-substituted tetra- to octachloro D/Fs [..]
|
|
|
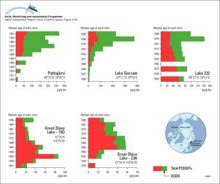
Organochlorine levels in polar bear adipose tissues (µg/g lw), adjusted to levels expected in 11-year-old males (after correction for age and sex), for sum-PCB, sum-CHL, sum-HCH, and sum-CBz, and in [..]
|
|
|
Tracer concentration on a vertical section (along Y=0 on Figure 346) after 15 years; a) no neptune, centered difference; b) neptune, flux-corrected transport; c,d) velocity normal to the section with [..]
|

|
|
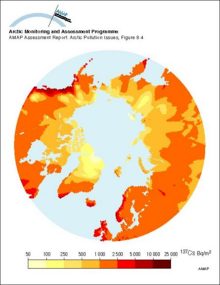
Estimated ground deposition of nuclear weapons fallout of 137Cs based on precipitation data, decay corrected to 1995
|
|
|
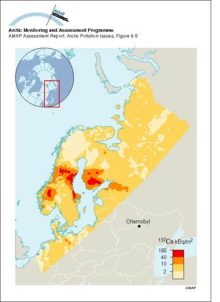
Ground deposition of 137Cs from the Chernoybl accident (values normalised to May 10, 1986)
|
|
|
Comparison of the predicted flux of 137Cs in milk and reindeer meat in different Arctic areas, for the first year after an assumed uniform deposition of 100 kBq/m2
|

|
|
Relative 137Cs output in foodstuffs from the different Arctic Norwegian counties in the first year after an assumed uniform deposition of 100 kBq/m2
|

|
|
The comparative importance of different foodstuffs as sources of 137Cs for the three Arctic Norwegian counties over the 1-year and 50-year period following an assumed uniform deposition of 100 kBq/m2
|

|

water OR waste searches for either of these words
oceans AND biodiversity searches for blocks with both words
pollution NEAR water searches for blocks with either of these words, with them being closer ranks higher
"climate change" searches for this phrase