|
Transport of 90Sr, originating from Sellafield, along the coast of Norway The highest values are found in the Norwegian Coastal Current and decrease northward
|

|
|
Temperature and salinity of the Labrador Sea The cold freshwater from the Arctic Ocean and Baffin Bay is seen above the continental shelf
|

|
|
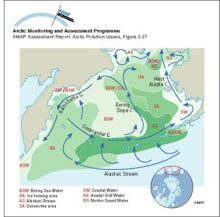
Schematic diagram of circulation and the extent of different water masses in the Bering Sea
|
|
|
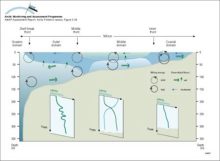
The different domains of the Bering Sea continental shelf are separated by fronts The coastal domain (depth <50m) tends to be vertically homogeneous, the middle domain (50-100m) shows a clear [..]
|
|
|
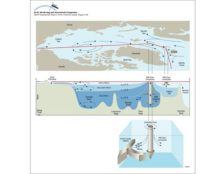
Circulation and water mass structure in the Arctic Ocean and Nordic Seas Mixing processes, such as brine formation, result in denser water that is transported off the shelves and into the deep basin
|
|
|
Schematic representation of the temperature and salinity structure of the upper Arctic Ocean and how the halocline layer is maintained by brine-rich water produced on the shelves
|

|
|
Time series of emissions of SO2 from European sources (Mylona 1993) and two major sources on the Kola Peninsula
|

|
|
The time series of (a) weekly-averaged non-seasalt (nss) sulfate aerosol at Alert, NWT, Canada, (b) monthly-averaged sulfate aerosol at Ny Ålesund, Norway, (c) weekly-averaged nitrate at Alert, and [..]
|

|
|
Emission rates of sulfur dioxide from Nikel together with annual average SO2 air concentrations measured at two sites in Norway (1978-1992)
|

|
|
Historical records of a) NO3- and b) SO42- concentrations from the Greenland icecap at Dye 3 c) A comparison of trends in the average SO42- and SO42- plus NO3- concentrations at Dye 3 in Greenland [..]
|

|
|
Calculated concentrations of SO2 and SO42- compared with measurements at Station Nord in northeastern Greenland
|

|
|
The time series of light scattering (?sp) and optical depth (?) at 500 nm at Barrow, Alaska
|

|
|
SMART model results for selected soil and lake output variables at Christmas lakes for the past 90 years and for three future scenarios assuming a 0%, 70% and 95% reduction of the present sulfur [..]
|

|
|
Monthly snow cover anomalies over northern hemispheric lands (including Greenland) between January 1972 and August 1995 Also shown are the 12-month running anomalies of hemispheric snow extent, [..]
|

|
|
Snow cover over northern hemisphere lands between 1972 and 1996 for different seasons Values are determined from analyses of NOAA snow charts created using visible satellite imagery
|

|

water OR waste searches for either of these words
oceans AND biodiversity searches for blocks with both words
pollution NEAR water searches for blocks with either of these words, with them being closer ranks higher
"climate change" searches for this phrase