|
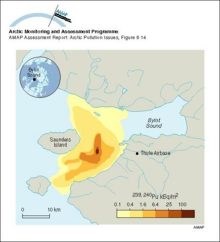
Activity concentrations of 239,240Pu in sediments near Thule, Greenland
|
|
|
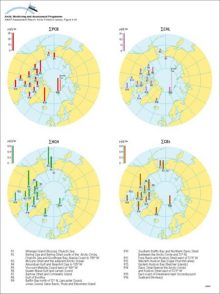
Organochlorine levels in polar bear adipose tissues (µg/g lw), adjusted to levels expected in 11-year-old males (after correction for age and sex), for sum-PCB, sum-CHL, sum-HCH, and sum-CBz, and in [..]
|
|
|
Tracer concentration on a vertical section (along Y=0 on Figure 346) after 15 years; a) no neptune, centered difference; b) neptune, flux-corrected transport; c,d) velocity normal to the section with [..]
|

|
|
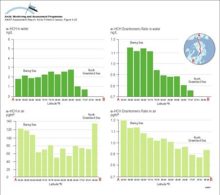
Water/air fugacity ratios (fw/fa) of alpha-HCH and gamma-HCH on a transect from the Bering Sea to the Greenland Sea in July and August 1994 A fugacity ratio of 1 indicates air-water equilibrium
|

|
|
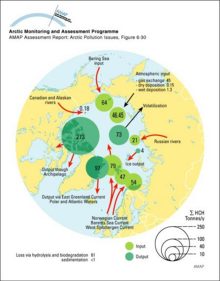
Sum-HCH budget for the Arctic Ocean (tonnes/y)
|
|
|
Trends in alpha-HCH and enantiomer ratios (ER) on a transect from the Bering Sea across the polar cap to the Greenland Sea during the Arctic Ocean Transect Study of July and August 1994
|
|
|
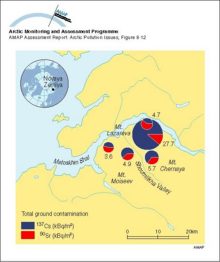
Local radionuclide contamination on Novaya Zemlya
|
|
|
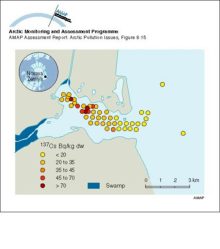
Activity concentrations of 137Cs in sediments of Abrosimov Bay
|
|
|
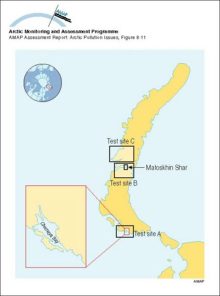
Nuclear weapons test sites on Novaya Zemlya
|
|
|
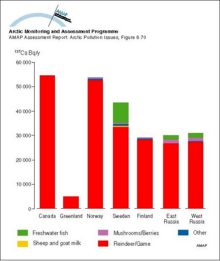
The relative contribution to the 137Cs content of the diet of the ‘selected’ population of various Arctic areas for the period 1990 to 1994
|
|
|
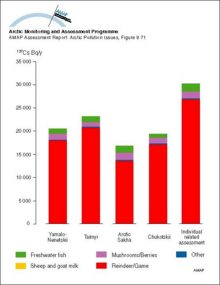
Estimated source of dietary intake of 137Cs by various indigenous population groups in different regions of Arctic Russia in 1993, and the AMAP region as a whole
|
|
|
Changes with time in 137Cs contamination in the food chain lichen - reindeer - humans
|

|
|
Temporal variation in calculated reindeer Tag values for different Arctic regions
|

|
|
Spatial trends in the net flux from reindeer meat in different Arctic areas, for the first year after an assumed uniform deposition of 100 kBq/m2
|

|
|
Temporal variation in cow milk Tag values for Sweden, Norway and Finland
|

|

water OR waste searches for either of these words
oceans AND biodiversity searches for blocks with both words
pollution NEAR water searches for blocks with either of these words, with them being closer ranks higher
"climate change" searches for this phrase