|
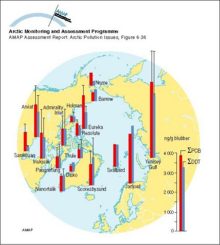
Sum-PCB and sum-DDT in ringed seal blubber (µg/g) Vertical bars denote standard deviation
|
|
|
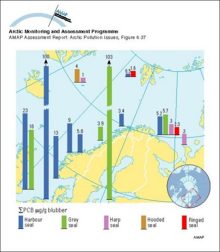
Sum-PCB levels in pinnipeds in Norway
|
|
|
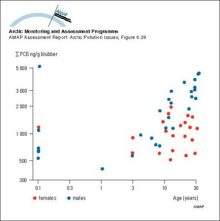
Variation of PCB with age in blubber of ringed seals (western Hudson Bay, Canada) A total of 24 females and 30 males were analyzed
|
|
|
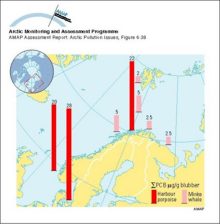
Sum-PCB levels in cetaceans in Norway
|
|
|
Correlations between concentrations (lw) of major persistent OCs and trophic level in the marine food web for Svalbard and Lancaster Sound Trophic level data were assigned based on Hobson and Welch [..]
|

|
|
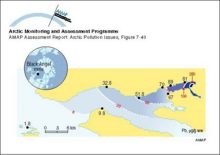
Lead levels in blue mussels (Mytilus edulis) in the fjord outside the Black Angel lead-zinc mine in West Greenland in 1986-87 Values on the fjord coast are measured concentrations Estimated [..]
|
|
|
Local differences in Cd concentrations in sedentary and stationary algae and biota from Nuuk and Uummannaq fjords, central West Greenland Levels are plotted as the percentage of the maximum [..]
|
|
|
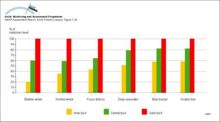
Temporal trend of Pb concentrations in growing tips of seaweed (Fucus vesiculosus) at the Black Angel lead-zinc mine in West Greenland The background value is estimated to be 02 µg/g dw
|

|
|
Temporal trend of Pb concentrations in liver tissue of spotted wolffish (Anarhichas minor) at the Black Angel lead-zinc mine in West Greenland
|

|
|
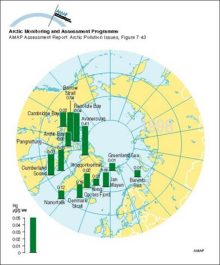
Circumpolar distribution of Hg levels in muscle tissue of Arctic cod (Boreogadus saida) Arithmetic mean concentrations
|
|
|
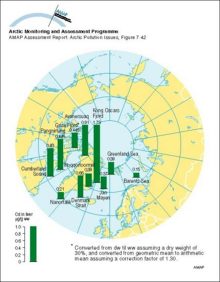
Circumpolar distribution of Cd levels in liver tissue of Arctic cod (Boreogadus saida) Arithmetic mean concentrations
|
|
|
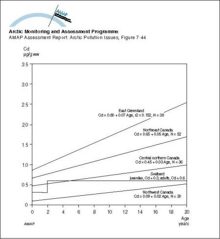
Age accumulation of Cd in liver of polar bears from different Arctic regions
|
|
|
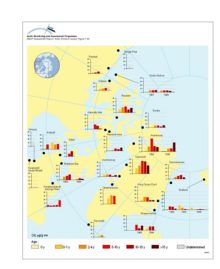
Distribution of Cd levels in liver tissue of ringed seal (Phoca hispida) of different ages Plots show selected data (geometric mean values) from Annex Table 7A15
|
|
|
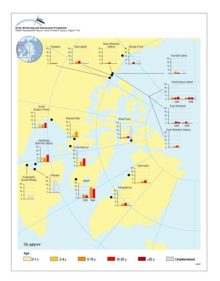
Distribution of Cd levels in liver tissue of beluga whale (Delphinapterus leucas) of different ages Plots show selected data (geometric mean values) from Annex Table 7A15
|
|
|
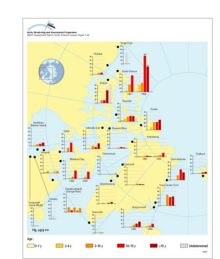
Distribution of Hg levels in liver tissue of ringed seal (Phoca hispida) of different ages Plots show selected data (geometric mean values) from Annex Table 7A15
|
|

water OR waste searches for either of these words
oceans AND biodiversity searches for blocks with both words
pollution NEAR water searches for blocks with either of these words, with them being closer ranks higher
"climate change" searches for this phrase