|
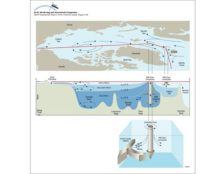
Circulation and water mass structure in the Arctic Ocean and Nordic Seas Mixing processes, such as brine formation, result in denser water that is transported off the shelves and into the deep basin
|
|
|
Distribution of radioactivity (PCi/L) in the surface layer of the ocean after ten years of simulation of Preller's model Source locations are the Ob, Yenisey and Pechora Rivers, as well as Sellafield
|

|
|
Yearly and depth-averaged concentrations (Bq/m3) of 137Cs after 6 years from Harms' model The sources are instantaneous releases of 1 PBq from the dump sites in Abrosimov Bay, Stepovogo Bay, Tsivolky [..]
|
|
|
Vertically integrated tracer burden shown after 15 years Units are burden per unit surface area, normalized by cumulative release Bottom topography is in meters; a) no neptune, centered difference, [..]
|
|
|
Ozone soundings at Sodankylä, Finland, 23 March 1995 The green line denotes the profile of partial pressure of ozone observed during the (type 2) anomaly The red line shows the monthly mean ozone [..]
|

|
|
Locations of sea dumping of radioactive waste in the Russian Arctic
|

|
|
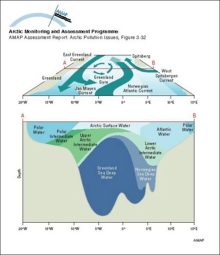
Schematic diagrams of the Greenland Sea showing the surface circulation (above) and water mass structure at a section across the central gyre (below)
|
|
|
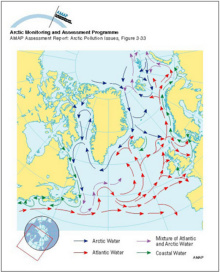
Major surface currents in the North Atlantic Ocean
|
|
|
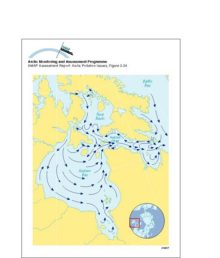
Surface currents in Hudson Bay, Hudson Strait and Foxe Basin
|
|
|
Transport of 90Sr, originating from Sellafield, along the coast of Norway The highest values are found in the Norwegian Coastal Current and decrease northward
|

|
|
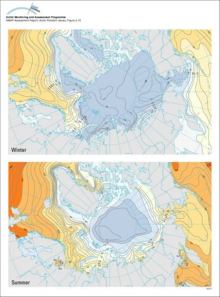
Winter and summer surface water temperatures (°C) in the Arctic Ocean and adjacent seas
|
|
|
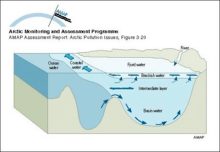
Conceptual model of the coastal zone and marine environments showing the main subcompartments and contaminant transfers, and exchanges with the atmosphere
|

|
|
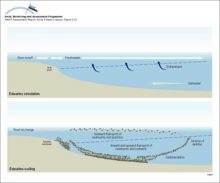
Sketch of main circulation pattern in a fjord
|
|
|
Illustration of water, sediment and nutrient cycling in estuaries Freshwater flows outward, transporting sediments, plankton and also contaminants Material that sinks into the inflowing seawater may [..]
|
|
|
Schematic representation of shelf processes involving transport of contaminants and sea ice
|

|

water OR waste searches for either of these words
oceans AND biodiversity searches for blocks with both words
pollution NEAR water searches for blocks with either of these words, with them being closer ranks higher
"climate change" searches for this phrase