Your query returned 88 graphics.
Results 1 - 15
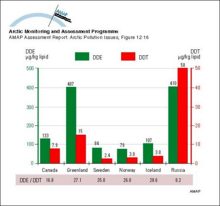
Mean maternal plasma lipid concentrations of DDE and DDT; figures below the graph show the DDE/DDT ratiosMean maternal plasma lipid concentrations of DDE and DDT; figures below the graph show the DDE/DDT ratios |
|
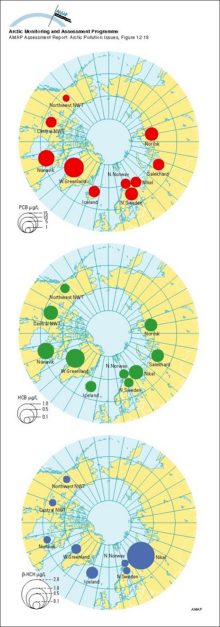
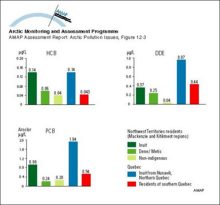
Geometric mean concentrations of PCB, HCB and B-HCH in maternal blood plasma; AMAP circumpolar study 1995, see Table 12A12Geometric mean concentrations of PCB, HCB and B-HCH in maternal blood plasma; AMAP circumpolar study 1995, see Table 12A12 |
|
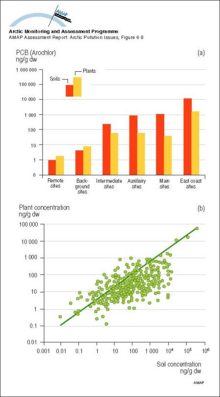
Concentrations of Aroclor PCBs in soils and plants (ng/g dw) associated with military radar sites in the Canadian Arctic a) Mean and maximum total PCB concentrations in soils and associated plants from remote (>20 km), backgroundConcentrations of Aroclor PCBs in soils and plants (ng/g dw) associated with military radar sites in the Canadian Arctic a) Mean and maximum total PCB concentrations in soils and associated plants [..] |
|
Historical profiles of PCBs (trichloro- and all other) in slices from dated sediment cores in Alaska, Canada, and Finland Median age of each slice is given on the vertical axis The green lines indicate the source function of PCBsHistorical profiles of PCBs (trichloro- and all other) in slices from dated sediment cores in Alaska, Canada, and Finland Median age of each slice is given on the vertical axis The green lines [..] |

|
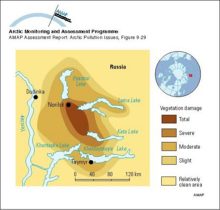
Vegetation damage zones around NorilskVegetation damage zones around Norilsk |
|
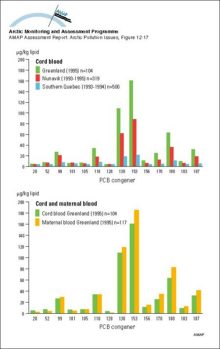
PCB congener profiles in cord blood of Canadian and Greenlandic population groups, and in cord and maternal blood from GreenlandPCB congener profiles in cord blood of Canadian and Greenlandic population groups, and in cord and maternal blood from Greenland |
|
(a) Critical deposition of sulfur, and (b) its exceedance, in forest soils of northern Europe and Russia (5th percentile of the calculation points in each EMEP grid cell)(a) Critical deposition of sulfur, and (b) its exceedance, in forest soils of northern Europe and Russia (5th percentile of the calculation points in each EMEP grid cell) |

|
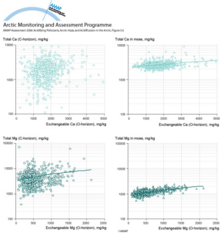
Ammonium acetate extractable Ca and Mg in the O-horizon of soilsAmmonium acetate extractable Ca and Mg in the O-horizon of soils (x-axis) vs. their total concentrations (aqua regia extractable) in the C-horizon of soils and in moss in 1995 |
|
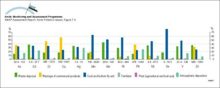
Global anthropogenic inputs of trace metals to soils at the beginning of the 1980s Numbers under the columns are the range of estimates of the inputs in thousands of tonnes per yearGlobal anthropogenic inputs of trace metals to soils at the beginning of the 1980s Numbers under the columns are the range of estimates of the inputs in thousands of tonnes per year |
|
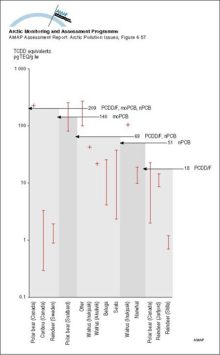
Body concentrations of PCDD/F and non-ortho and mono-ortho PCBs as TCDD equivalents (pg/g lw) in Arctic mammals compared to thresholds for immunosuppression in harbor seal for the same combinations of substances analyzedBody concentrations of PCDD/F and non-ortho and mono-ortho PCBs as TCDD equivalents (pg/g lw) in Arctic mammals compared to thresholds for immunosuppression in harbor seal for the same combinations of [..] |
|
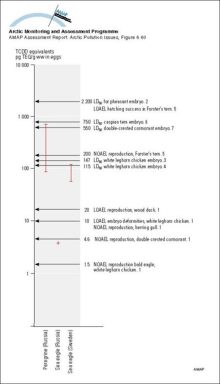
Concentrations of PCDD/F and non-ortho and mono-ortho PCBs as TCDD equivalents (pg/g ww) in Arctic bird eggs compared to thresholds for avian effects (1 Giesy et al 1994b, 2 Nosek et al 1992, 3 Verrett 1976,Concentrations of PCDD/F and non-ortho and mono-ortho PCBs as TCDD equivalents (pg/g ww) in Arctic bird eggs compared to thresholds for avian effects (1 Giesy et al 1994b, 2 Nosek et al 1992, 3 [..] |
|
Deposition of PCBs, as mono/di/trichloro- and tetra-nonachlorobiphenyls) in snow cores from the Agassiz Ice Cap (northern Ellesmere Island, Canada) Combined light and dark shaded sections of each bar indicate sum-PCB fluxDeposition of PCBs, as mono/di/trichloro- and tetra-nonachlorobiphenyls) in snow cores from the Agassiz Ice Cap (northern Ellesmere Island, Canada) Combined light and dark shaded sections of each bar [..] |

|
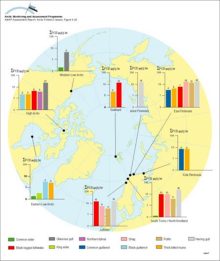
Levels of PCBs in seabird eggs (µg/g lw) Values written above bars are actual mean concentrations Wet weight means are given in Annex Table 6A16Levels of PCBs in seabird eggs (µg/g lw) Values written above bars are actual mean concentrations Wet weight means are given in Annex Table 6A16 |
|
Geometric mean levels of HCB, DDE and PCBs in cord blood of newborns in different Canadian population groupsGeometric mean levels of HCB, DDE and PCBs in cord blood of newborns in different Canadian population groups |
|
Source regions for HCH, chlordane, toxaphene, and PCBs in Arctic air based on 5-day back-trajectories for elevated air concentrations at Tagish, Alert, and Ny-ÅlesundSource regions for HCH, chlordane, toxaphene, and PCBs in Arctic air based on 5-day back-trajectories for elevated air concentrations at Tagish, Alert, and Ny-Ålesund |

|

water OR waste searches for either of these words
oceans AND biodiversity searches for blocks with both words
pollution NEAR water searches for blocks with either of these words, with them being closer ranks higher
"climate change" searches for this phrase