Your query returned 101 graphics.
Results 91 - 101
Estimates of emissions of As, Cd, Hg and Pb to the atmosphere from major source categories in the United States Numbers under the columns are emissions in tonnes per yearEstimates of emissions of As, Cd, Hg and Pb to the atmosphere from major source categories in the United States Numbers under the columns are emissions in tonnes per year |

|
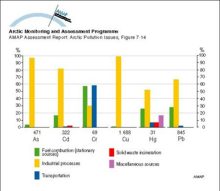
Estimates of emissions of As, Cd, Cr, Cu, Hg and Pb to the atmosphere from major source categories in Canada in 1982 Numbers under the columns are emissions in tonnes per yearEstimates of emissions of As, Cd, Cr, Cu, Hg and Pb to the atmosphere from major source categories in Canada in 1982 Numbers under the columns are emissions in tonnes per year |
|
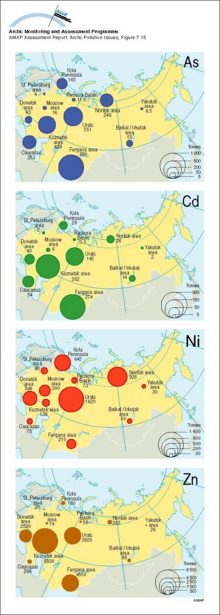
Emissions of As, Cd, Ni and Zn to the atmosphere from major sources in the former Soviet Union in 1979/80Emissions of As, Cd, Ni and Zn to the atmosphere from major sources in the former Soviet Union in 1979/80 |
|
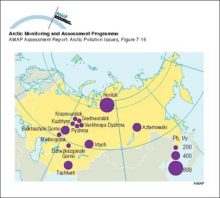
Major point sources (non-ferrous metal smelters) of Pb to the atmosphere in the Urals and the Asian part of the former Soviet UnionMajor point sources (non-ferrous metal smelters) of Pb to the atmosphere in the Urals and the Asian part of the former Soviet Union |
|
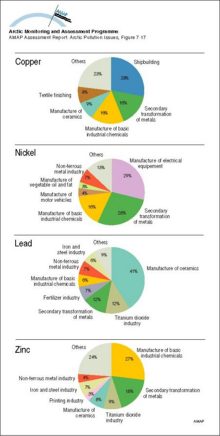
The relative importance of different branches of industry in discharges of Cu, Ni, Pb and Zn to the aquatic environment from major point sources in the European Community (EC)The relative importance of different branches of industry in discharges of Cu, Ni, Pb and Zn to the aquatic environment from major point sources in the European Community (EC) |
|
Averaged upper (3000 m) air concentrations of Pb in winter (December-February) and summer (June-August) as modeled by the updated (1996) hemispheric EMEP transport model in a simulation for the reference year 1988Averaged upper (3000 m) air concentrations of Pb in winter (December-February) and summer (June-August) as modeled by the updated (1996) hemispheric EMEP transport model in a simulation for the [..] |

|
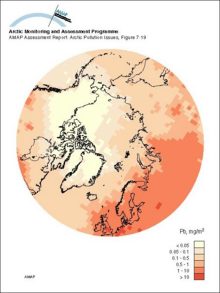
Lead deposition as modeled by the updated (1996) hemispheric EMEP transport model in a simulation for the reference year 1988Lead deposition as modeled by the updated (1996) hemispheric EMEP transport model in a simulation for the reference year 1988 |
|
Average contributions from various sources to the atmospheric concentrations of elements in winter air samples at Ny-Ålesund, SvalbardAverage contributions from various sources to the atmospheric concentrations of elements in winter air samples at Ny-Ålesund, Svalbard |

|
The ten major point sources, and their emissions of As and Cd to the atmosphere, in Europe at the beginning of the 1990s Numbers above the columns are emissions in tonnes per yearThe ten major point sources, and their emissions of As and Cd to the atmosphere, in Europe at the beginning of the 1990s Numbers above the columns are emissions in tonnes per year |

|
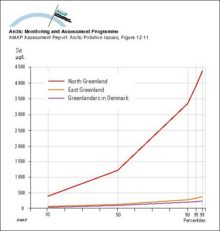
Distribution (in percentiles) of whole blood selenium concentrations in East and North Greenland and in Greenlanders living in DenmarkDistribution (in percentiles) of whole blood selenium concentrations in East and North Greenland and in Greenlanders living in Denmark |
|
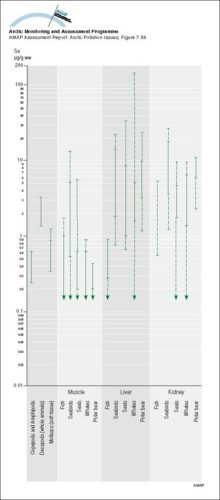
Summary of ranges of Se levels (mean values) in Arctic marine organisms Solid parts of the lines indicate ranges for Greenlandic dataSummary of ranges of Se levels (mean values) in Arctic marine organisms Solid parts of the lines indicate ranges for Greenlandic data |
|

water OR waste searches for either of these words
oceans AND biodiversity searches for blocks with both words
pollution NEAR water searches for blocks with either of these words, with them being closer ranks higher
"climate change" searches for this phrase