|
SO2 emissions north of 50°N (modified after Benkovitz et al 1995, see Figure 91) showing point source emissions from Arctic and subarctic non-ferrous smelters and including natural DMS sources from [..]
|
|
|
Time series of emissions of SO2 from European sources (Mylona 1993) and two major sources on the Kola Peninsula
|

|
|
Emission rates of sulfur dioxide from Nikel together with annual average SO2 air concentrations measured at two sites in Norway (1978-1992)
|

|
|
(a) Vertical distribution of SOx (SO2 + SO42-) concentrations averaged over the area north of 75°N, and (b) contributions from the different sources
|

|
|
(a) The contribution from the different sources to the total deposition, averaged over the area north of 75°N from October 1990 to May 1994, (b) the calculated total monthly depositions of SOx [..]
|

|
|
Vertical distribution of Arctic haze in summer, winter, and the whole year Sulfur air concentrations and relative source-contribution (%) for different heights above the ground are shown The [..]
|

|
|
Time trends of mean methylmercury concentrations
|

|
|
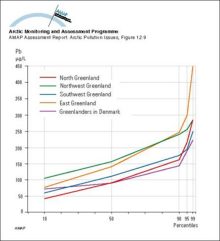
Distribution (in percentiles) of whole blood lead concentrations in four regions in Greenland and in Greenlanders living in Denmark
|
|
|
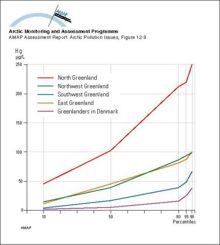
Distribution (in percentiles) of whole blood mercury concentrations in four regions in Greenland and in Greenlanders living in Denmark
|
|
|
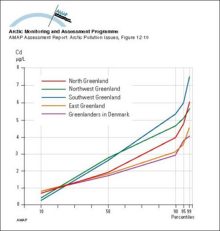
Distribution (in percentiles) of whole blood cadmium concentrations in four regions in Greenland and in Greenlanders living in Denmark
|
|
|
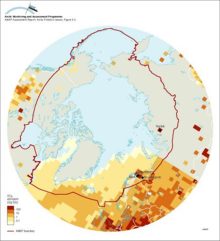
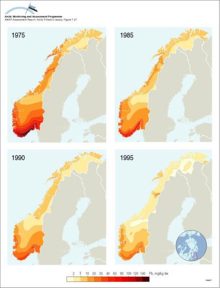
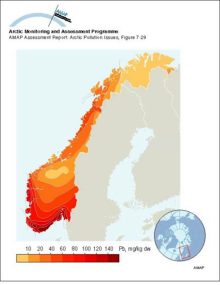
Latitudinal gradient of deposition of Pb in Norway in different years, as reflected by Pb concentrations in moss
|
|
|
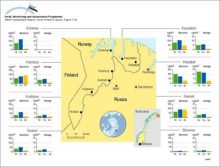
Average (15-month) and 24-h average maximum air concentrations of Ni, Cu and As measured at several stations in northern Norway near to major point sources on the Kola Peninsula
|
|
|
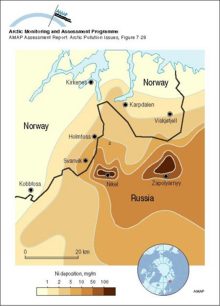
Nickel deposition to snow on the Kola Peninsula in April 1990
|
|
|
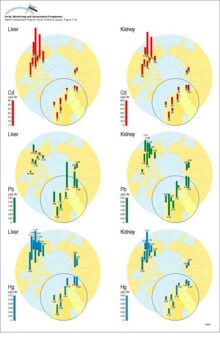
Circumpolar distribution of Cd, Pb and Hg levels in liver and kidney tissue of willow ptarmigan (Lagopus lagopus)
|
|
|
Lead concentrations in soil in Norway in 1975
|
|

water OR waste searches for either of these words
oceans AND biodiversity searches for blocks with both words
pollution NEAR water searches for blocks with either of these words, with them being closer ranks higher
"climate change" searches for this phrase