Your query returned 154 graphics.
Results 76 - 90
Trends in concentration of major organochlorines in blubber of female ringed seals over 6 to 10 years at 3 sites in the eastern Canadian Arctic (N=10-14 animals for each year/site)Trends in concentration of major organochlorines in blubber of female ringed seals over 6 to 10 years at 3 sites in the eastern Canadian Arctic (N=10-14 animals for each year/site) |

|
Global emissions of Pb to the atmosphere from various sources and source regions in 1989 Numbers under the columns are maximum estimates of the total emissions in tonnesGlobal emissions of Pb to the atmosphere from various sources and source regions in 1989 Numbers under the columns are maximum estimates of the total emissions in tonnes |

|
Spatial distribution of global emissions of Hg in 1990 within a 1° x 1° grid The total emission inventory is 2144 tonnes HgSpatial distribution of global emissions of Hg in 1990 within a 1° x 1° grid The total emission inventory is 2144 tonnes Hg |

|
Contributions from different continents and from different sources to the global emissions of Hg to the atmosphereContributions from different continents and from different sources to the global emissions of Hg to the atmosphere |

|
The ten major point sources, and their emissions of As and Cd to the atmosphere, in Europe at the beginning of the 1990s Numbers above the columns are emissions in tonnes per yearThe ten major point sources, and their emissions of As and Cd to the atmosphere, in Europe at the beginning of the 1990s Numbers above the columns are emissions in tonnes per year |

|
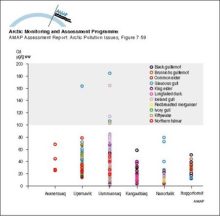
Cadmium levels in kidney of adult marine birds from Greenland Levels associated with potential for kidney damage are above 100 µg/g wwCadmium levels in kidney of adult marine birds from Greenland Levels associated with potential for kidney damage are above 100 µg/g ww |
|
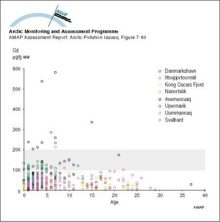
Cadmium levels in kidney of adult ringed seals from Greenland and Svalbard Levels associated with potential for kidney damage are above 100-200 µg/g wwCadmium levels in kidney of adult ringed seals from Greenland and Svalbard Levels associated with potential for kidney damage are above 100-200 µg/g ww |
|
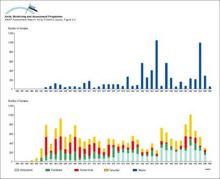
Available data in the AMAP radioactivity database as a function of timeAvailable data in the AMAP radioactivity database as a function of time |
|
Seawater concentrations of 137Cs in the Barents and East Greenland Seas compared to the yearly releases from SellafieldSeawater concentrations of 137Cs in the Barents and East Greenland Seas compared to the yearly releases from Sellafield |

|
Changes with time in 131I activity concentration in Finnish air samplesChanges with time in 131I activity concentration in Finnish air samples |
|
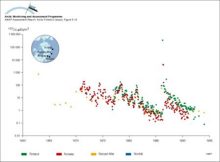
Changes with time in 137Cs activity concentration in air in Norway, Finland and RussiaChanges with time in 137Cs activity concentration in air in Norway, Finland and Russia |
|
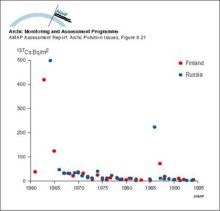
Changes with time in wet and dry deposition of 137Cs in Arctic Finland and north west Russia (Nenets Autonomous Okrug)Changes with time in wet and dry deposition of 137Cs in Arctic Finland and north west Russia (Nenets Autonomous Okrug) |
|
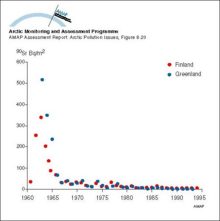
Changes with time in wet and dry deposition of 90Sr in Arctic Finland and GreenlandChanges with time in wet and dry deposition of 90Sr in Arctic Finland and Greenland |
|
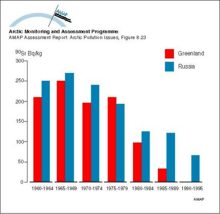
Changes with time in 90Sr activity concentration (5-year means) in lichens in Greenland and RussiaChanges with time in 90Sr activity concentration (5-year means) in lichens in Greenland and Russia |
|
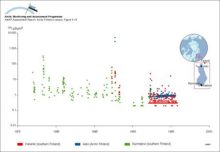
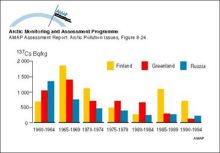
Changes with time in 137Cs activity concentrations (5-year means) in lichens in Arctic Finland, Greenland, and RussiaChanges with time in 137Cs activity concentrations (5-year means) in lichens in Arctic Finland, Greenland, and Russia |
|

water OR waste searches for either of these words
oceans AND biodiversity searches for blocks with both words
pollution NEAR water searches for blocks with either of these words, with them being closer ranks higher
"climate change" searches for this phrase