|
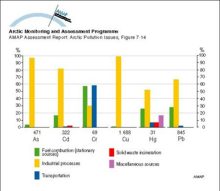
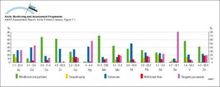
Estimates of emissions of As, Cd, Cr, Cu, Hg and Pb to the atmosphere from major source categories in Canada in 1982 Numbers under the columns are emissions in tonnes per year
|
|
|
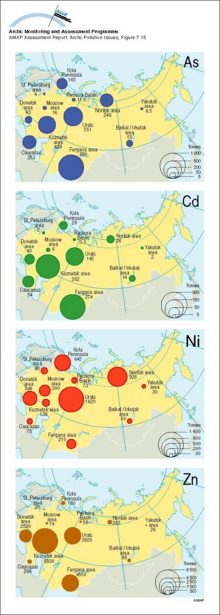
Emissions of As, Cd, Ni and Zn to the atmosphere from major sources in the former Soviet Union in 1979/80
|
|
|
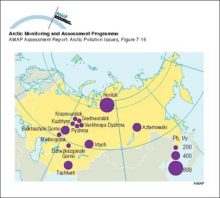
Major point sources (non-ferrous metal smelters) of Pb to the atmosphere in the Urals and the Asian part of the former Soviet Union
|
|
|
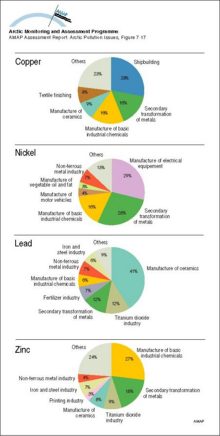
The relative importance of different branches of industry in discharges of Cu, Ni, Pb and Zn to the aquatic environment from major point sources in the European Community (EC)
|
|
|
(a) Critical loads of acidity expressed as sulfur (5th percentile presented for each grid) for lakes in northern Fennoscandia and surface waters on Svalbard, and (b) their exceedance (95th percentile)
|

|
|
Distribution of radioactivity (PCi/L) in the surface layer of the ocean after ten years of simulation of Preller's model Source locations are the Ob, Yenisey and Pechora Rivers, as well as Sellafield
|

|
|
Yearly and depth-averaged concentrations (Bq/m3) of 137Cs after 6 years from Harms' model The sources are instantaneous releases of 1 PBq from the dump sites in Abrosimov Bay, Stepovogo Bay, Tsivolky [..]
|
|
|
Vertically integrated tracer burden shown after 15 years Units are burden per unit surface area, normalized by cumulative release Bottom topography is in meters; a) no neptune, centered difference, [..]
|
|
|
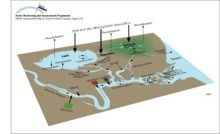
Conceptual model of the terrestrial/freshwater compartment showing the main subcompartments and contaminant transfers, and exchanges with the atmosphere and oceans
|
|
|
Conceptual model of the coastal zone and marine environments showing the main subcompartments and contaminant transfers, and exchanges with the atmosphere
|

|
|
Schematic representation of shelf processes involving transport of contaminants and sea ice
|

|
|
Transport of 90Sr, originating from Sellafield, along the coast of Norway The highest values are found in the Norwegian Coastal Current and decrease northward
|

|
|
Schematic diagram of the Combined Model Ten climatic zones, each containing well-mixed compartments, are connected by meridional atmospheric and oceanic exchange
|
|
|
Global emissions of trace metals to the atmosphere from natural sources Numbers under the columns are the range of estimates of the emissions in thousands of tonnes per year
|
|
|
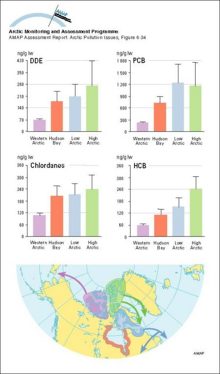
Migration patterns of four main stocks of eider ducks from the Canadian Arctic Organochlorines in the same four stocks
|
|

water OR waste searches for either of these words
oceans AND biodiversity searches for blocks with both words
pollution NEAR water searches for blocks with either of these words, with them being closer ranks higher
"climate change" searches for this phrase