Your query returned 145 graphics.
Results 46 - 60
Temporal variation in calculated reindeer Tag values for different Arctic regionsTemporal variation in calculated reindeer Tag values for different Arctic regions |

|
Spatial trends in the net flux from reindeer meat in different Arctic areas, for the first year after an assumed uniform deposition of 100 kBq/m2Spatial trends in the net flux from reindeer meat in different Arctic areas, for the first year after an assumed uniform deposition of 100 kBq/m2 |

|
Temporal variation in cow milk Tag values for Sweden, Norway and FinlandTemporal variation in cow milk Tag values for Sweden, Norway and Finland |

|
Comparison of the predicted flux of 137Cs in milk and reindeer meat in different Arctic areas, for the first year after an assumed uniform deposition of 100 kBq/m2Comparison of the predicted flux of 137Cs in milk and reindeer meat in different Arctic areas, for the first year after an assumed uniform deposition of 100 kBq/m2 |

|
Emission rates of sulfur dioxide from Nikel together with annual average SO2 air concentrations measured at two sites in Norway (1978-1992)Emission rates of sulfur dioxide from Nikel together with annual average SO2 air concentrations measured at two sites in Norway (1978-1992) |

|
(a) The contribution from the different sources to the total deposition, averaged over the area north of 75°N from October 1990 to May 1994, (b) the calculated total monthly depositions of SOx averaged over the area north of 75°N, and (c) the(a) The contribution from the different sources to the total deposition, averaged over the area north of 75°N from October 1990 to May 1994, (b) the calculated total monthly depositions of SOx [..] |

|
Tracer concentration on a vertical section (along Y=0 on Figure 346) after 15 years; a) no neptune, centered difference; b) neptune, flux-corrected transport; c,d) velocity normal to the section with positive "into" the page, negative "out" of the page;Tracer concentration on a vertical section (along Y=0 on Figure 346) after 15 years; a) no neptune, centered difference; b) neptune, flux-corrected transport; c,d) velocity normal to the section with [..] |

|
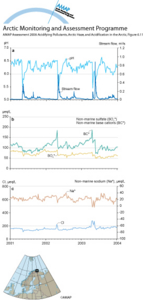
Surface water runoff from the Dalelva catchment, northeastern Norway, 2001–2003Surface water runoff from the Dalelva catchment, northeastern Norway, 2001–2003. (a) streamwater flow and pH, (b) non-marine concentrations of sulfate and base cations, and (c) chloride and non-marine [..] |
|
The time series of light scattering (?sp) and optical depth (?) at 500 nm at Barrow, AlaskaThe time series of light scattering (?sp) and optical depth (?) at 500 nm at Barrow, Alaska |

|
Model calculations of sulfur deposition and fraction of dry deposition for the period July 1990 to June 1991 in northern Fennoscandia and the Kola PeninsulaModel calculations of sulfur deposition and fraction of dry deposition for the period July 1990 to June 1991 in northern Fennoscandia and the Kola Peninsula |

|
Model calculations of ground level yearly average sulfur dioxide air concentration on the Kola PeninsulaModel calculations of ground level yearly average sulfur dioxide air concentration on the Kola Peninsula |

|
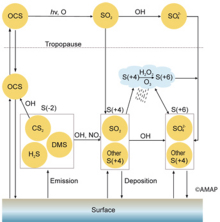
Atmospheric sulphur cycleAtmospheric sulphur cycle |
|
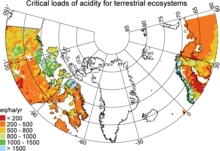
Critical loads of acidity for soilsCritical loads of acidity for terrestrial ecosystems in northern Europe and Canada north of 60 degrees N. |
|
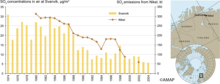
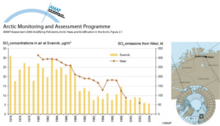
Sulphur dioxide concentrations in air and emissions from the smelter at NikelAnnual SO2 concentrations in air at ground level at the Svanvik monitoring station, and SO2 emissions from the non-ferrous metal smelters at Nikel |
|
SO2 concentration at the Svanvik monitoring stationAnnual SO2 concentration in air at ground level at the Svanvik monitoring station and SO2 emissions from the non-ferrous metal smelters at Nikel |
|

water OR waste searches for either of these words
oceans AND biodiversity searches for blocks with both words
pollution NEAR water searches for blocks with either of these words, with them being closer ranks higher
"climate change" searches for this phrase