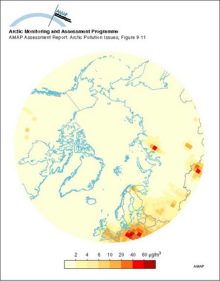
The predicted (1988) average surface air sulfur dioxide concentrations in the Arctic

The predicted (1988) average surface air sulfur dioxide concentrations in the Arctic

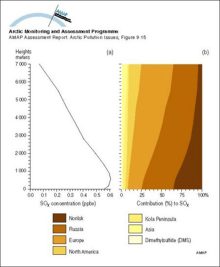
(a) Vertical distribution of SOx (SO2 + SO42-) concentrations averaged over the area north of 75°N, and (b) contributions from the different sources

(a) Vertical distribution of SOx (SO2 + SO42-) concentrations averaged over the area north of 75°N, and (b) contributions from the different sources

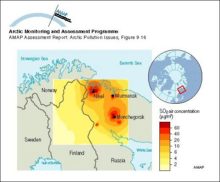
Model calculations of ground level yearly average sulfur dioxide air concentration on the Kola Peninsula

Model calculations of ground level yearly average sulfur dioxide air concentration on the Kola Peninsula

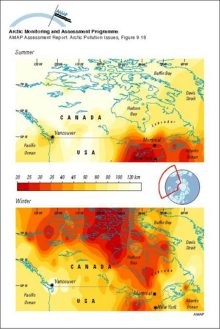
Summer and winter visibility observations (for relative humidities less than 80%) for the period 1951 to 1993 in North America

Summer and winter visibility observations (for relative humidities less than 80%) for the period 1951 to 1993 in North America

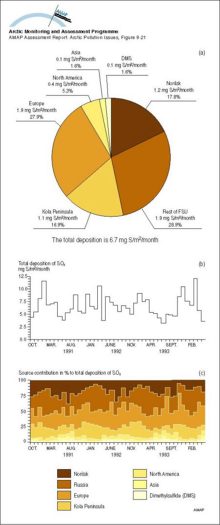
(a) The contribution from the different sources to the total deposition, averaged over the area north of 75°N from October 1990 to May 1994, (b) the calculated total monthly depositions of SOx averaged over the area north of 75°N, and (c) the

(a) The contribution from the different sources to the total deposition, averaged over the area north of 75°N from October 1990 to May 1994, (b) the calculated total monthly depositions of SOx [..]
(a) The contribution from the different sources to the total deposition, averaged over the area north of 75°N from October 1990 to May 1994, (b) the calculated total monthly depositions of SOx averaged over the area north of 75°N, and (c) the

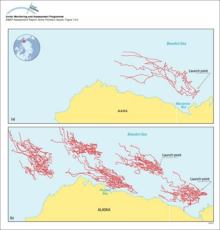
(a) Trajectories of five satellite-tracked buoys launched in Mackenzie Bay, Canada, and (b) results of 30-day trajectories of oil launched from five hypothetical spill locations in the Beaufort Sea

(a) Trajectories of five satellite-tracked buoys launched in Mackenzie Bay, Canada, and (b) results of 30-day trajectories of oil launched from five hypothetical spill locations in the Beaufort Sea

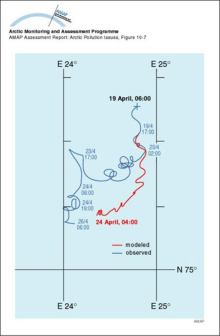
Model evaluation comparing a five-day model simulation with results of an oil release experiment in the marginal ice zone near Svalbard in April 1993

Model evaluation comparing a five-day model simulation with results of an oil release experiment in the marginal ice zone near Svalbard in April 1993

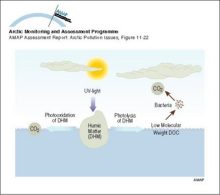
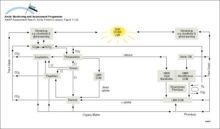
Illustration of the role of UV radiation in the biogeochemical cycling of DOC

Illustration of the role of UV radiation in the biogeochemical cycling of DOC

Illustration of the role of UV radiation in various light-dependent processes Natural UV radiation impacts the numbers, distribution and activity of several aquatic ecosystem targets and thus, theoretically, their interactions

Illustration of the role of UV radiation in various light-dependent processes Natural UV radiation impacts the numbers, distribution and activity of several aquatic ecosystem targets and thus, [..]
Illustration of the role of UV radiation in various light-dependent processes Natural UV radiation impacts the numbers, distribution and activity of several aquatic ecosystem targets and thus, theoretically, their interactions

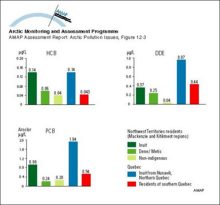
Geometric mean levels of HCB, DDE and PCBs in cord blood of newborns in different Canadian population groups

Geometric mean levels of HCB, DDE and PCBs in cord blood of newborns in different Canadian population groups

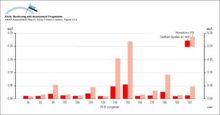
Concentrations of PCB congeners in cord plasma from Nunavik and southern Quebec newborns

Concentrations of PCB congeners in cord plasma from Nunavik and southern Quebec newborns

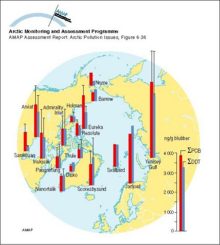
Sum-PCB and sum-DDT in ringed seal blubber (µg/g) Vertical bars denote standard deviation

Sum-PCB and sum-DDT in ringed seal blubber (µg/g) Vertical bars denote standard deviation

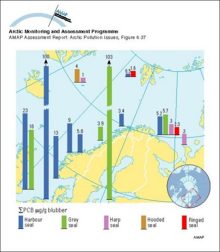
Sum-PCB levels in pinnipeds in Norway

Sum-PCB levels in pinnipeds in Norway

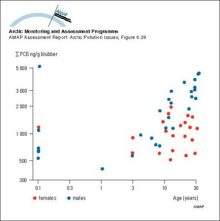
Variation of PCB with age in blubber of ringed seals (western Hudson Bay, Canada) A total of 24 females and 30 males were analyzed

Variation of PCB with age in blubber of ringed seals (western Hudson Bay, Canada) A total of 24 females and 30 males were analyzed

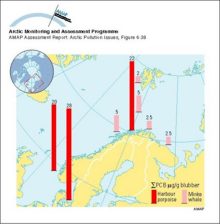
Sum-PCB levels in cetaceans in Norway

Sum-PCB levels in cetaceans in Norway


To refine your search you can combine your search strings with AND, OR, NOT and NEAR and phrases can be quoted:
water OR waste searches for either of these words
oceans AND biodiversity searches for blocks with both words
pollution NEAR water searches for blocks with either of these words, with them being closer ranks higher
"climate change" searches for this phrase