Your query returned 66 graphics.
Results 1 - 15
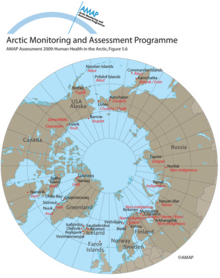
Locations and ethnicity of populations included in AMAP human health studiesLocations and ethnicity of populations included in AMAP human health studies |
|
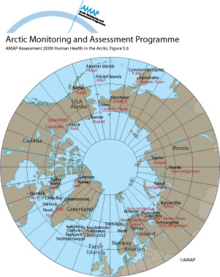
Locations and ethnicity of populations included in AMAP human health studiesLocations and ethnicity of populations included in AMAP human health studies |
|
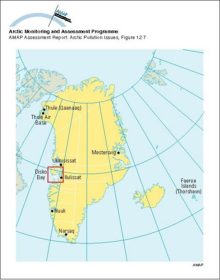
Human health study locations in Greenland and the Faeroe Islands; Disko Bay was the main area studied under the AMAP monitoring programme (1994-96)Human health study locations in Greenland and the Faeroe Islands; Disko Bay was the main area studied under the AMAP monitoring programme (1994-96) |
|
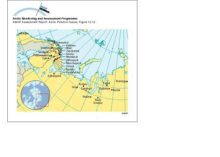
Human health study locations in Arctic Norway, Russia and Finland; red dots indicate the main communities studied under the AMAP monitoring programmeHuman health study locations in Arctic Norway, Russia and Finland; red dots indicate the main communities studied under the AMAP monitoring programme |
|
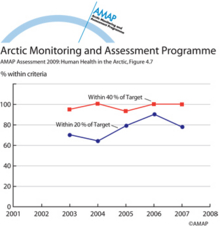
Performance trends for individual analytes: CB28Performance trends for individual analytes: CB28. Data from all participants are plotted |
|
Performance trends for individual analytes: CB138Performance trends for individual analytes: CB138. Data from all participants are plotted |
|
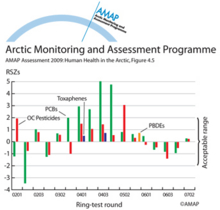
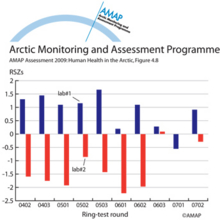
An individual participant’s performance using RSZsAn individual participant’s performance using RSZs |
|
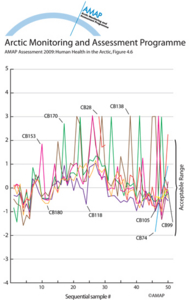
Individual PCB congener performance over timeIndividual PCB congener performance over time. |
|
Lipid analysis performance over timeLipid analysis performance over time. Data from all participants are plotted |
|
A comparison of lipid results for two laboratoriesA comparison of lipid results for two laboratories |
|
Comparison of total lipid results obtained from gravimetric and enzymatic methodsComparison of total lipid results obtained from gravimetric and enzymatic methods |
|
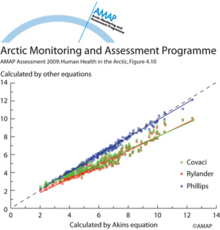
Calculation of total lipids in serum from enzymatic dataCalculation of total lipids in serum from enzymatic data |
|
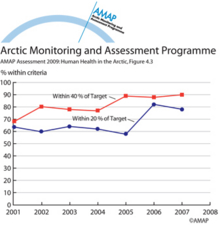
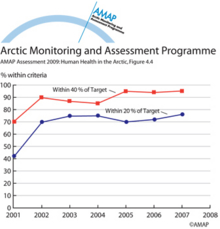
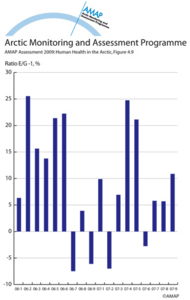
Performance trends for POPs 2002 to 2006Performance trends for POPs 2002 to 2006 |
|
Temporal trends of POPs and metals in maternal blood samples from Nunavik, CanadaTemporal trends of POPs and metals in maternal blood samples from Nunavik, Canada |

|
Temporal trends of POPs and metals in maternal blood samples from Nuuk and Disko Bay, GreenlandTemporal trends of POPs and metals in maternal blood samples from Nuuk and Disko Bay, Greenland |

|

water OR waste searches for either of these words
oceans AND biodiversity searches for blocks with both words
pollution NEAR water searches for blocks with either of these words, with them being closer ranks higher
"climate change" searches for this phrase