|
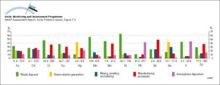
Global anthropogenic inputs of trace metals to aquatic ecosystems at the beginning of the 1980s Numbers under the columns are the range of estimates of the inputs in thousands of tonnes per year
|
|
|
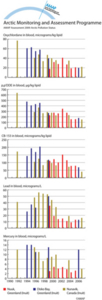
Temporal trends of fluorinated compounds in marine mammals
|

|
|
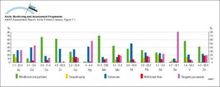
Global emissions of trace metals to the atmosphere from natural sources Numbers under the columns are the range of estimates of the emissions in thousands of tonnes per year
|
|
|
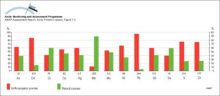
Comparison of global emissions of trace metals to the atmosphere from natural and anthropogenic sources in 1983 Numbers under the columns are the median values of estimates of total emissions in [..]
|
|
|
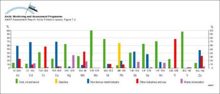
Global emissions of trace metals to the atmosphere at the beginning of the 1980s from anthropogenic sources
|
|
|
Global emissions of Pb to the atmosphere from various sources and source regions in 1989 Numbers under the columns are maximum estimates of the total emissions in tonnes
|

|
|
Spatial distribution of global emissions of Hg in 1990 within a 1° x 1° grid The total emission inventory is 2144 tonnes Hg
|

|
|
Contributions from different continents and from different sources to the global emissions of Hg to the atmosphere
|

|
|
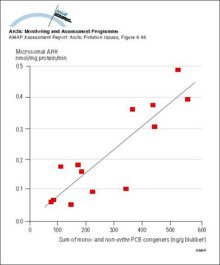
Aryl hydrocarbon hydroxylase (AHH, nmol/mg microsomal protein/min) activities in liver microsomes of beluga taken from the Eskimo Lakes area of the Mackenzie Delta, as a function of PCB congener [..]
|
|
|
Spatial distribution of emissions of Pb within the 150 km x 150 km EMEP grid system for the area north of latitude 50° N in 1989
|

|
|
Changes over time in levels of legacy POPs and metals in blood of pregnant women from three communities in Greenland and Canada
|
|
|
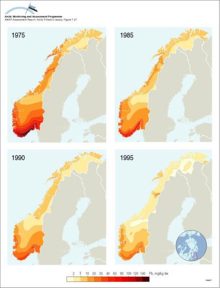
Latitudinal gradient of deposition of Pb in Norway in different years, as reflected by Pb concentrations in moss
|
|
|
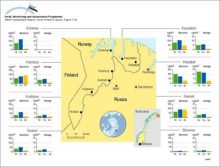
Average (15-month) and 24-h average maximum air concentrations of Ni, Cu and As measured at several stations in northern Norway near to major point sources on the Kola Peninsula
|
|
|
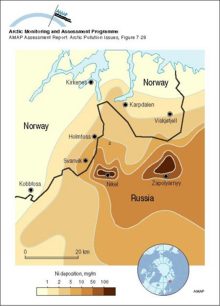
Nickel deposition to snow on the Kola Peninsula in April 1990
|
|
|
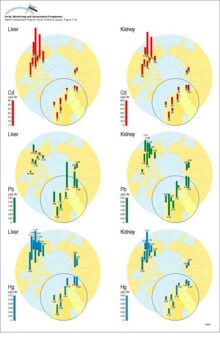
Circumpolar distribution of Cd, Pb and Hg levels in liver and kidney tissue of willow ptarmigan (Lagopus lagopus)
|
|

water OR waste searches for either of these words
oceans AND biodiversity searches for blocks with both words
pollution NEAR water searches for blocks with either of these words, with them being closer ranks higher
"climate change" searches for this phrase