Your query returned 38 graphics.
Results 31 - 38
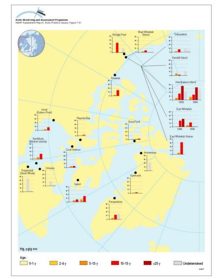
Distribution of Hg levels in liver tissue of beluga whale (Delphinapterus leucas) of different ages (years) Plots show selected data (geometric mean values) from Annex Table 7A15Distribution of Hg levels in liver tissue of beluga whale (Delphinapterus leucas) of different ages (years) Plots show selected data (geometric mean values) from Annex Table 7A15 |
|
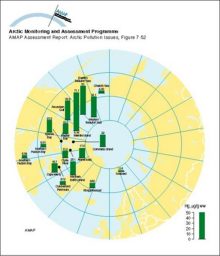
Distribution of Hg levels (age adjusted to 69 years, Svalbard adults) in liver tissue of polar bear (Ursus maritimus)Distribution of Hg levels (age adjusted to 69 years, Svalbard adults) in liver tissue of polar bear (Ursus maritimus) |
|
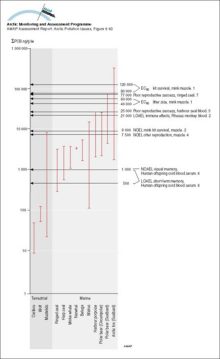
Sum-PCB (ng/g lw) in Arctic mammals compared to thresholds for mammalian effects (1 Leonards et al 1995, 2 Tryphonas 1994, 3 Kihlström et al 1992, 4 Olsson et al 1996a, 5 Boon et al 1987, 6 Ahlborg et al 1992, 7 Helle et al 1976b)Sum-PCB (ng/g lw) in Arctic mammals compared to thresholds for mammalian effects (1 Leonards et al 1995, 2 Tryphonas 1994, 3 Kihlström et al 1992, 4 Olsson et al 1996a, 5 Boon et al 1987, 6 Ahlborg et [..] |
|
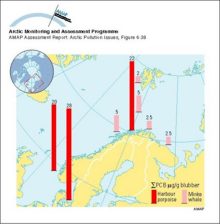
Sum-PCB levels in cetaceans in NorwaySum-PCB levels in cetaceans in Norway |
|
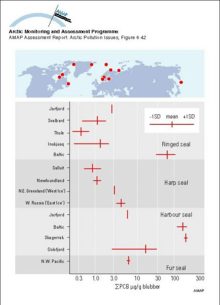
Comparison of sum-PCB concentrations in seal blubber from various Arctic regions with results from the same species in temperate waters Vertical bars represent means and the horizontal bars the standard deviation, where availableComparison of sum-PCB concentrations in seal blubber from various Arctic regions with results from the same species in temperate waters Vertical bars represent means and the horizontal bars the [..] |
|
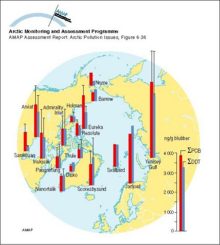
Sum-PCB and sum-DDT in ringed seal blubber (µg/g) Vertical bars denote standard deviationSum-PCB and sum-DDT in ringed seal blubber (µg/g) Vertical bars denote standard deviation |
|
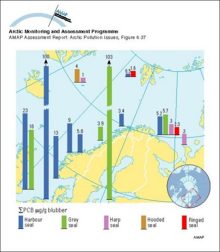
Sum-PCB levels in pinnipeds in NorwaySum-PCB levels in pinnipeds in Norway |
|
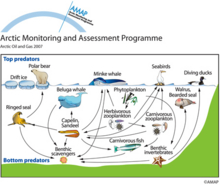
Simplified Barents Sea food-webThe Barents Sea is moderately productive, but being large, it supports large fish populations. Walrus, bowheads and other large whales were seriously depleted by this previous hunting, and have been [..] |
|

water OR waste searches for either of these words
oceans AND biodiversity searches for blocks with both words
pollution NEAR water searches for blocks with either of these words, with them being closer ranks higher
"climate change" searches for this phrase