Your query returned 99 graphics.
Results 61 - 75
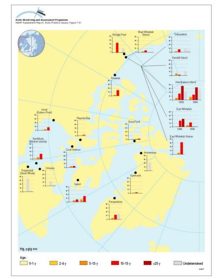
Distribution of Hg levels in liver tissue of beluga whale (Delphinapterus leucas) of different ages (years) Plots show selected data (geometric mean values) from Annex Table 7A15Distribution of Hg levels in liver tissue of beluga whale (Delphinapterus leucas) of different ages (years) Plots show selected data (geometric mean values) from Annex Table 7A15 |
|
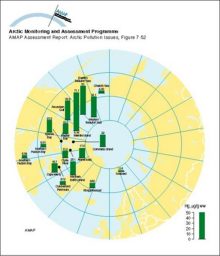
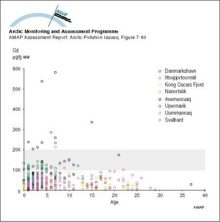
Distribution of Hg levels (age adjusted to 69 years, Svalbard adults) in liver tissue of polar bear (Ursus maritimus)Distribution of Hg levels (age adjusted to 69 years, Svalbard adults) in liver tissue of polar bear (Ursus maritimus) |
|
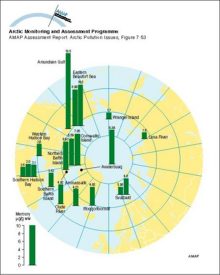
Distribution of Hg levels in hair of polar bear (Ursus maritimus)Distribution of Hg levels in hair of polar bear (Ursus maritimus) |
|
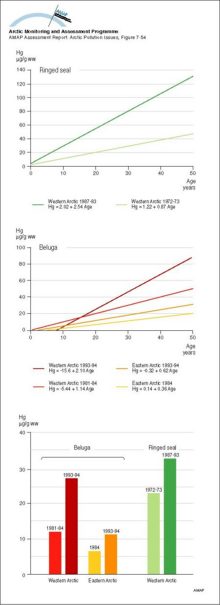
Age accumulation and temporal comparison of mean concentrations of Hg in liver tissue of ringed seal (Phoca hispida) and beluga whale (Delphinapterus leucas) fron the Canadian ArcticAge accumulation and temporal comparison of mean concentrations of Hg in liver tissue of ringed seal (Phoca hispida) and beluga whale (Delphinapterus leucas) fron the Canadian Arctic |
|
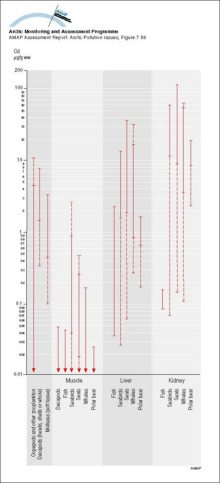
Summary of ranges of Cd levels (mean values) in Arctic marine organisms Solid parts of the lines indicate ranges for Greenlandic dataSummary of ranges of Cd levels (mean values) in Arctic marine organisms Solid parts of the lines indicate ranges for Greenlandic data |
|
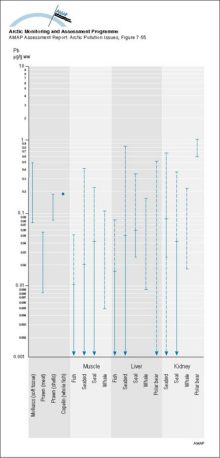
Summary of ranges of Pb levels (mean values) in Arctic marine organisms Solid parts of the lines indicate ranges for Greenlandic dataSummary of ranges of Pb levels (mean values) in Arctic marine organisms Solid parts of the lines indicate ranges for Greenlandic data |
|
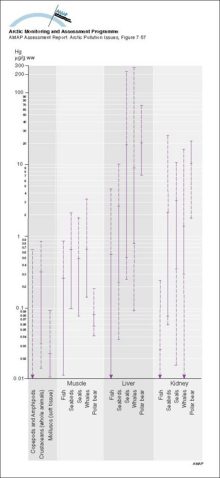
Summary of ranges of Hg levels (mean values) in Arctic marine organisms Solid parts of the lines indicate ranges for Greenlandic dataSummary of ranges of Hg levels (mean values) in Arctic marine organisms Solid parts of the lines indicate ranges for Greenlandic data |
|
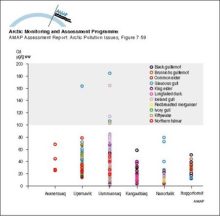
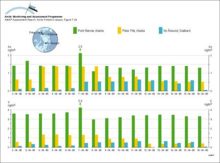
Cadmium levels in kidney of adult marine birds from Greenland Levels associated with potential for kidney damage are above 100 µg/g wwCadmium levels in kidney of adult marine birds from Greenland Levels associated with potential for kidney damage are above 100 µg/g ww |
|
Cadmium levels in kidney of adult ringed seals from Greenland and Svalbard Levels associated with potential for kidney damage are above 100-200 µg/g wwCadmium levels in kidney of adult ringed seals from Greenland and Svalbard Levels associated with potential for kidney damage are above 100-200 µg/g ww |
|
Composition of particles measured at different altitudes during winter flights in the Norwegian ArcticComposition of particles measured at different altitudes during winter flights in the Norwegian Arctic |

|
Concentrations of As and V in aerosols measured during concurrent measurement campaigns on Svalbard and two locations in Alaska during April 1986Concentrations of As and V in aerosols measured during concurrent measurement campaigns on Svalbard and two locations in Alaska during April 1986 |
|
Global emissions of Pb to the atmosphere from various sources and source regions in 1989 Numbers under the columns are maximum estimates of the total emissions in tonnesGlobal emissions of Pb to the atmosphere from various sources and source regions in 1989 Numbers under the columns are maximum estimates of the total emissions in tonnes |

|
Spatial distribution of global emissions of Hg in 1990 within a 1° x 1° grid The total emission inventory is 2144 tonnes HgSpatial distribution of global emissions of Hg in 1990 within a 1° x 1° grid The total emission inventory is 2144 tonnes Hg |

|
Contributions from different continents and from different sources to the global emissions of Hg to the atmosphereContributions from different continents and from different sources to the global emissions of Hg to the atmosphere |

|
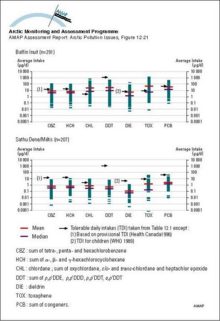
Organochlorine intake from traditional food consumed by indigenous women in the Canadian ArcticOrganochlorine intake from traditional food consumed by indigenous women in the Canadian Arctic |
|

water OR waste searches for either of these words
oceans AND biodiversity searches for blocks with both words
pollution NEAR water searches for blocks with either of these words, with them being closer ranks higher
"climate change" searches for this phrase