|
Temporal trends in concentrations of sum-HCH and toxaphene in Arctic air
|

|
|
Temporal trends in PCB and DDT levels (µg/g lw ± 95% confidence limits) of otter muscle in Sweden Levels are based on means of 26, 16, and 28 samples (northern Sweden) and 29, 9, and 15 samples [..]
|

|
|
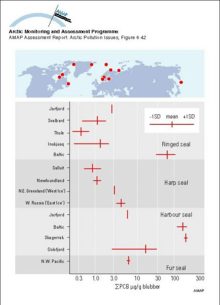
Comparison of sum-PCB concentrations in seal blubber from various Arctic regions with results from the same species in temperate waters Vertical bars represent means and the horizontal bars the [..]
|
|
|
Temporal trends in OC levels (ng/g lw) in reindeer from Abisko, Sweden Levels are usually based on a pool of 10 samples
|

|
|
Concentrations, as geometric means, of major organochlorine groups in burbot liver at Fort Good Hope, NWT, Canada (1986-94) Vertical bars denote standard errors
|

|
|
Temporal trends in levels of PCB, DDT, alpha-HCH, and HCB in muscle from Lake Storvindeln pike and Lake Abiskojaure char in Sweden Mean levels (µg/g lw) and 95% confidence intervals of the mean are [..]
|

|
|
Temporal trends in PCB and DDE levels in Arctic seabird eggs from Prince Leopold Island, Canada (1975-1993)
|

|
|
Levels of PCB congeners and PCDD/Fs (ng/g lw) in Lake Storvindeln pike muscle between 1968 and 1992
|

|
|
Temporal trends of sum-PCB and sum-DDT in blubber of female ringed seals from Holman Island in the western Canadian Arctic Vertical bars represent one SD
|

|
|
Trends in sum-PCB, sum-DDT, sum-CHL, and toxaphene over a ten year period (20 years for DDT in the Mackenzie Delta) for male narwhal and beluga blubber samples from the Canadian Arctic (N=8-26)
|

|
|
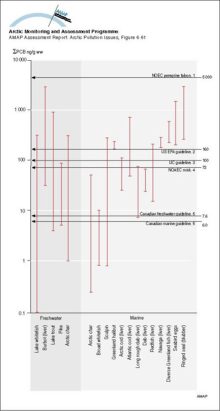
Sum-PCB (ng/g ww) in Arctic animals as food items compared to no-effect-concentrations (NOAEC) and environmental quality guidelines for protecting fish-eating/aquatic wildlife (1 Baril et al 1990, 2 [..]
|
|
|
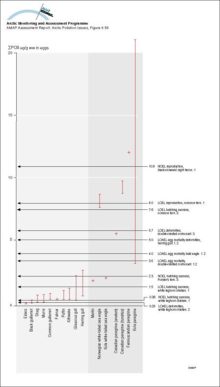
Concentrations of sum-PCB (µg/g ww) in Arctic bird eggs compared to thresholds for avian effects (1 Barron et al 1995, 2 Giesy et al 1994b, 3 Bosveld and Van den Berg 1994)
|
|
|
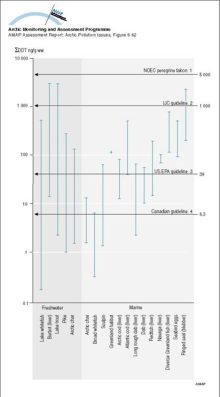
Sum-DDT (ng/g ww) in Arctic animals as food items compared to no-effect-concentrations (NOAEC) and environmental quality guidelines for protecting fish-eating/aquatic wildlife (1 Baril et al 1990, 2 [..]
|
|
|
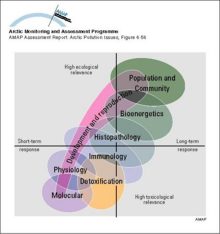
The relationship between response levels of biological organization and the toxicological relevance and time scale of responses
|
|
|
Relative tissue concentrations of organochlorine compounds detected in lichen, and in adipose tissue of caribou and wolf at three locations in the Northwest Territories, Canada
|

|

water OR waste searches for either of these words
oceans AND biodiversity searches for blocks with both words
pollution NEAR water searches for blocks with either of these words, with them being closer ranks higher
"climate change" searches for this phrase