Your query returned 161 graphics.
Results 106 - 120
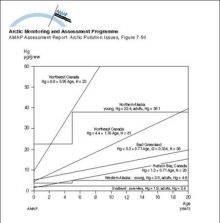
Age accumulation of Hg in liver of polar bears from different Arctic regionsAge accumulation of Hg in liver of polar bears from different Arctic regions |
|
Distribution of Hg levels in liver tissue of beluga whale (Delphinapterus leucas) of different ages (years) Plots show selected data (geometric mean values) from Annex Table 7A15Distribution of Hg levels in liver tissue of beluga whale (Delphinapterus leucas) of different ages (years) Plots show selected data (geometric mean values) from Annex Table 7A15 |
|
Distribution of Hg levels (age adjusted to 69 years, Svalbard adults) in liver tissue of polar bear (Ursus maritimus)Distribution of Hg levels (age adjusted to 69 years, Svalbard adults) in liver tissue of polar bear (Ursus maritimus) |
|
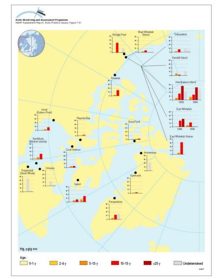
Distribution of Hg levels in hair of polar bear (Ursus maritimus)Distribution of Hg levels in hair of polar bear (Ursus maritimus) |
|
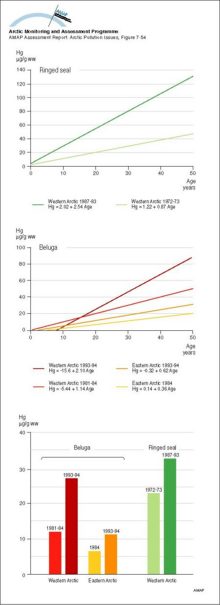
Age accumulation and temporal comparison of mean concentrations of Hg in liver tissue of ringed seal (Phoca hispida) and beluga whale (Delphinapterus leucas) fron the Canadian ArcticAge accumulation and temporal comparison of mean concentrations of Hg in liver tissue of ringed seal (Phoca hispida) and beluga whale (Delphinapterus leucas) fron the Canadian Arctic |
|
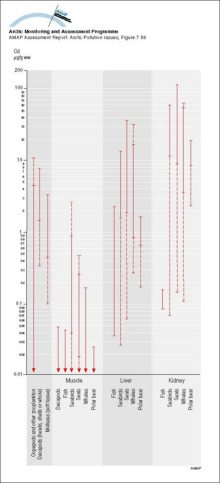
Summary of ranges of Cd levels (mean values) in Arctic marine organisms Solid parts of the lines indicate ranges for Greenlandic dataSummary of ranges of Cd levels (mean values) in Arctic marine organisms Solid parts of the lines indicate ranges for Greenlandic data |
|
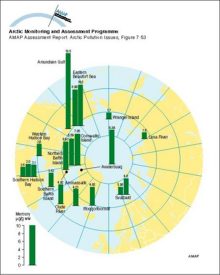
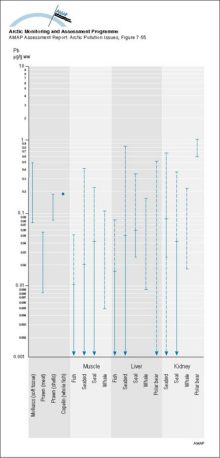
Summary of ranges of Pb levels (mean values) in Arctic marine organisms Solid parts of the lines indicate ranges for Greenlandic dataSummary of ranges of Pb levels (mean values) in Arctic marine organisms Solid parts of the lines indicate ranges for Greenlandic data |
|
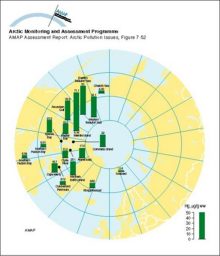
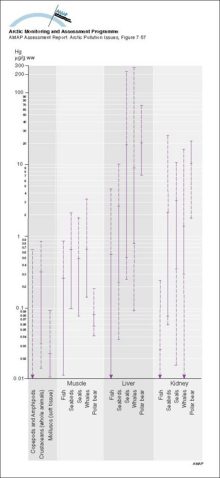
Summary of ranges of Hg levels (mean values) in Arctic marine organisms Solid parts of the lines indicate ranges for Greenlandic dataSummary of ranges of Hg levels (mean values) in Arctic marine organisms Solid parts of the lines indicate ranges for Greenlandic data |
|
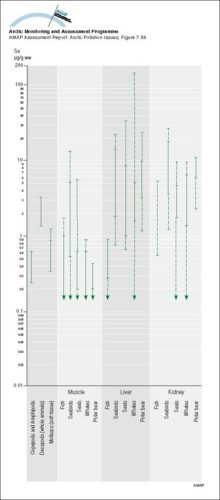
Summary of ranges of Se levels (mean values) in Arctic marine organisms Solid parts of the lines indicate ranges for Greenlandic dataSummary of ranges of Se levels (mean values) in Arctic marine organisms Solid parts of the lines indicate ranges for Greenlandic data |
|
Yearly intake of 137Cs from various dietary components by the average population of Arctic FinlandYearly intake of 137Cs from various dietary components by the average population of Arctic Finland |
|
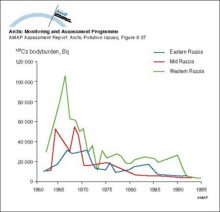
Changes with time in 137Cs wholebody measurements of Russian reindeer herdersChanges with time in 137Cs wholebody measurements of Russian reindeer herders |
|
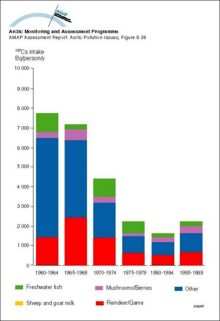
Yearly intake of 137Cs from various dietary components by the ‘selected’ population of Arctic FinlandYearly intake of 137Cs from various dietary components by the ‘selected’ population of Arctic Finland |
|
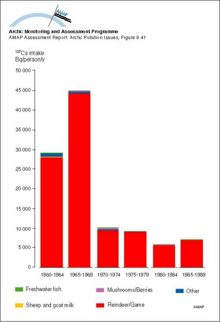
Yearly intake of 137Cs from various dietary components by the ‘selected’ population of GreenlandYearly intake of 137Cs from various dietary components by the ‘selected’ population of Greenland |
|
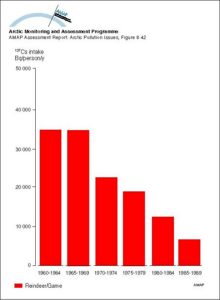
Yearly intake of 137Cs from various dietary components by the average population of GreenlandYearly intake of 137Cs from various dietary components by the average population of Greenland |
|
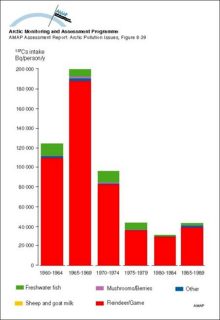
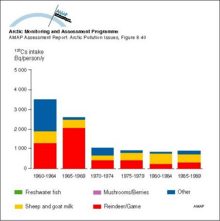
Yearly intake of 137Cs from various dietary components by the average population of Arctic CanadaYearly intake of 137Cs from various dietary components by the average population of Arctic Canada |
|

water OR waste searches for either of these words
oceans AND biodiversity searches for blocks with both words
pollution NEAR water searches for blocks with either of these words, with them being closer ranks higher
"climate change" searches for this phrase