Your query returned 160 graphics.
Results 76 - 90
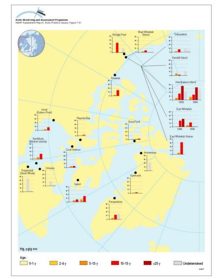
Temporal trend of Pb concentrations in growing tips of seaweed (Fucus vesiculosus) at the Black Angel lead-zinc mine in West Greenland The background value is estimated to be 02 µg/g dwTemporal trend of Pb concentrations in growing tips of seaweed (Fucus vesiculosus) at the Black Angel lead-zinc mine in West Greenland The background value is estimated to be 02 µg/g dw |

|
Temporal trend of Pb concentrations in liver tissue of spotted wolffish (Anarhichas minor) at the Black Angel lead-zinc mine in West GreenlandTemporal trend of Pb concentrations in liver tissue of spotted wolffish (Anarhichas minor) at the Black Angel lead-zinc mine in West Greenland |

|
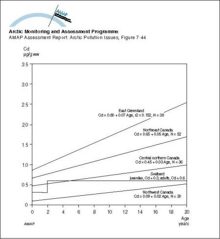
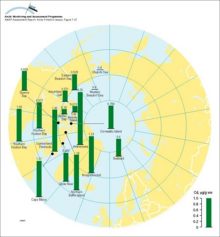
Age accumulation of Cd in liver of polar bears from different Arctic regionsAge accumulation of Cd in liver of polar bears from different Arctic regions |
|
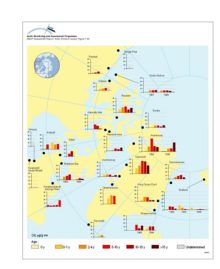
Distribution of Cd levels in liver tissue of ringed seal (Phoca hispida) of different ages Plots show selected data (geometric mean values) from Annex Table 7A15Distribution of Cd levels in liver tissue of ringed seal (Phoca hispida) of different ages Plots show selected data (geometric mean values) from Annex Table 7A15 |
|
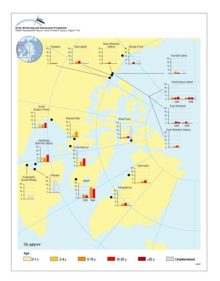
Distribution of Cd levels in liver tissue of beluga whale (Delphinapterus leucas) of different ages Plots show selected data (geometric mean values) from Annex Table 7A15Distribution of Cd levels in liver tissue of beluga whale (Delphinapterus leucas) of different ages Plots show selected data (geometric mean values) from Annex Table 7A15 |
|
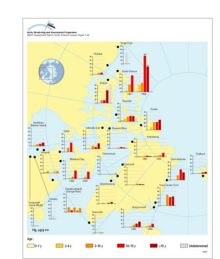
Distribution of Hg levels in liver tissue of ringed seal (Phoca hispida) of different ages Plots show selected data (geometric mean values) from Annex Table 7A15Distribution of Hg levels in liver tissue of ringed seal (Phoca hispida) of different ages Plots show selected data (geometric mean values) from Annex Table 7A15 |
|
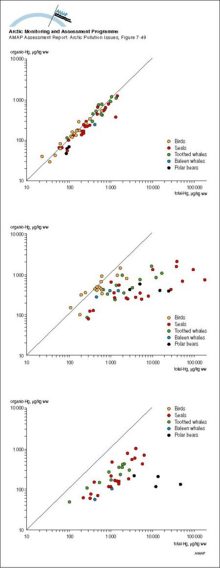
Organic mercury versus total mercury in muscle, liver and kidney tissue of Greenlandic marine animals The lines indicates 100% organic mercuryOrganic mercury versus total mercury in muscle, liver and kidney tissue of Greenlandic marine animals The lines indicates 100% organic mercury |
|
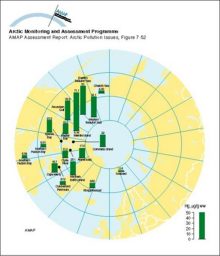
Distribution of Cd levels (age adjusted to 69 years, Svalbard adult) in liver tissue of polar bear (Ursus maritimus)Distribution of Cd levels (age adjusted to 69 years, Svalbard adult) in liver tissue of polar bear (Ursus maritimus) |
|
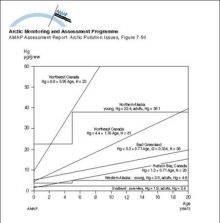
Age accumulation of Hg in liver of polar bears from different Arctic regionsAge accumulation of Hg in liver of polar bears from different Arctic regions |
|
Distribution of Hg levels in liver tissue of beluga whale (Delphinapterus leucas) of different ages (years) Plots show selected data (geometric mean values) from Annex Table 7A15Distribution of Hg levels in liver tissue of beluga whale (Delphinapterus leucas) of different ages (years) Plots show selected data (geometric mean values) from Annex Table 7A15 |
|
Distribution of Hg levels (age adjusted to 69 years, Svalbard adults) in liver tissue of polar bear (Ursus maritimus)Distribution of Hg levels (age adjusted to 69 years, Svalbard adults) in liver tissue of polar bear (Ursus maritimus) |
|
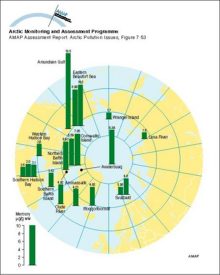
Distribution of Hg levels in hair of polar bear (Ursus maritimus)Distribution of Hg levels in hair of polar bear (Ursus maritimus) |
|
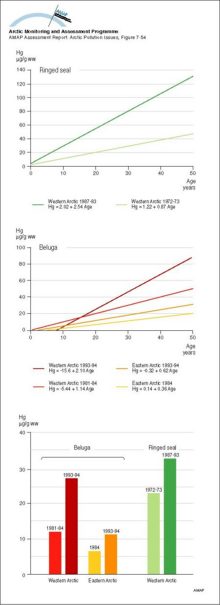
Age accumulation and temporal comparison of mean concentrations of Hg in liver tissue of ringed seal (Phoca hispida) and beluga whale (Delphinapterus leucas) fron the Canadian ArcticAge accumulation and temporal comparison of mean concentrations of Hg in liver tissue of ringed seal (Phoca hispida) and beluga whale (Delphinapterus leucas) fron the Canadian Arctic |
|
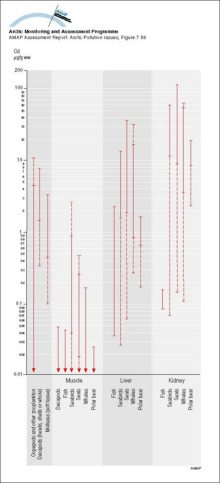
Summary of ranges of Cd levels (mean values) in Arctic marine organisms Solid parts of the lines indicate ranges for Greenlandic dataSummary of ranges of Cd levels (mean values) in Arctic marine organisms Solid parts of the lines indicate ranges for Greenlandic data |
|
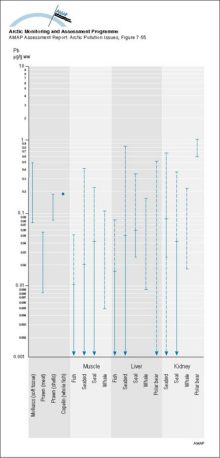
Summary of ranges of Pb levels (mean values) in Arctic marine organisms Solid parts of the lines indicate ranges for Greenlandic dataSummary of ranges of Pb levels (mean values) in Arctic marine organisms Solid parts of the lines indicate ranges for Greenlandic data |
|

water OR waste searches for either of these words
oceans AND biodiversity searches for blocks with both words
pollution NEAR water searches for blocks with either of these words, with them being closer ranks higher
"climate change" searches for this phrase