|
Snow cover over northern hemisphere lands between 1972 and 1996 for different seasons Values are determined from analyses of NOAA snow charts created using visible satellite imagery
|

|
|
History of temperature changes in central Greenland over the last 40 000 years, from the GISP2 core, showing very large and probably abrupt changes
|

|
|
History of snow accumulation in central Greenland during the most recent glaciation, as measured in the GISP2 core The 25-year running mean, represented in all panels, shows very large and rapid [..]
|

|
|
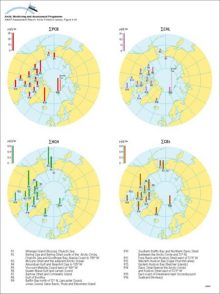
Trends in (annual average) ozone mixing ratio over Canada from 1980 to 1993
|

|
|
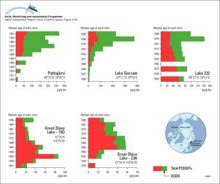
Concentration (pg/g dw) profiles for octachlorodioxin (OCDD) and total PCDD/Fs in dated sediment cores from Arctic Canada and Finland Sum-PCDD/Fs = sum of 2,3,7,8-substituted tetra- to octachloro D/Fs [..]
|
|
|
Organochlorine levels in polar bear adipose tissues (µg/g lw), adjusted to levels expected in 11-year-old males (after correction for age and sex), for sum-PCB, sum-CHL, sum-HCH, and sum-CBz, and in [..]
|
|
|
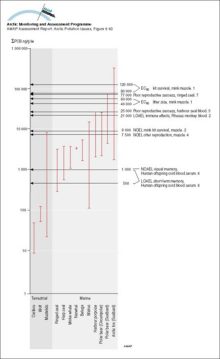
Sum-PCB (ng/g lw) in Arctic mammals compared to thresholds for mammalian effects (1 Leonards et al 1995, 2 Tryphonas 1994, 3 Kihlström et al 1992, 4 Olsson et al 1996a, 5 Boon et al 1987, 6 Ahlborg et [..]
|
|
|
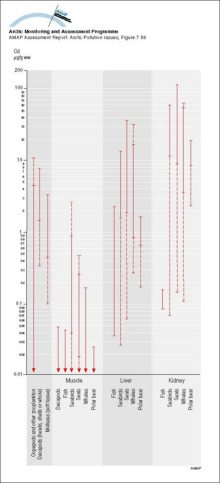
Summary of ranges of Cd levels (mean values) in Arctic marine organisms Solid parts of the lines indicate ranges for Greenlandic data
|
|
|
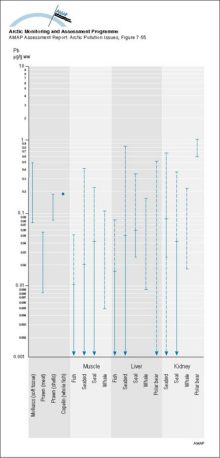
Summary of ranges of Pb levels (mean values) in Arctic marine organisms Solid parts of the lines indicate ranges for Greenlandic data
|
|
|
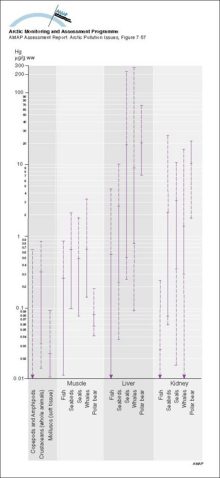
Summary of ranges of Hg levels (mean values) in Arctic marine organisms Solid parts of the lines indicate ranges for Greenlandic data
|
|
|
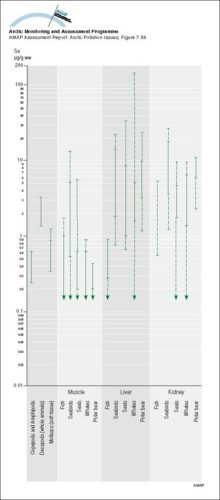
Summary of ranges of Se levels (mean values) in Arctic marine organisms Solid parts of the lines indicate ranges for Greenlandic data
|
|
|
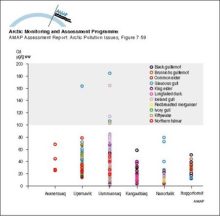
Cadmium levels in kidney of adult marine birds from Greenland Levels associated with potential for kidney damage are above 100 µg/g ww
|
|
|
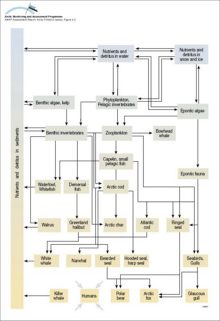
Generalized marine food web
|
|
|
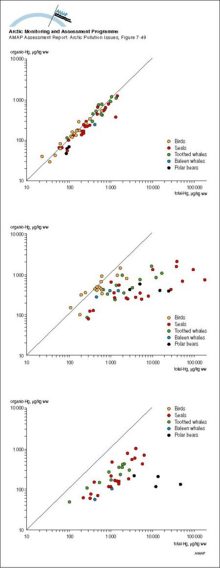
Organic mercury versus total mercury in muscle, liver and kidney tissue of Greenlandic marine animals The lines indicates 100% organic mercury
|
|
|
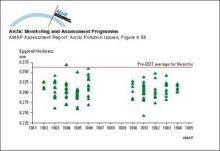
Shell thickness (mm) of peregrine falcon eggs representing 109 clutches produced in Rankin Inlet, NWT, Canada from 1981 to 1986 and from 1990 to 1994
|
|

water OR waste searches for either of these words
oceans AND biodiversity searches for blocks with both words
pollution NEAR water searches for blocks with either of these words, with them being closer ranks higher
"climate change" searches for this phrase