|
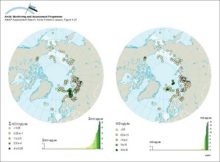
Concentrations of sum-HCH and HCB in marine surface sediments (from grab samples or from top slices of cores) on a circumpolar basis, and the ranked distribution of values
|
|
|
Water/air fugacity ratios (fw/fa) of alpha-HCH and gamma-HCH on a transect from the Bering Sea to the Greenland Sea in July and August 1994 A fugacity ratio of 1 indicates air-water equilibrium
|

|
|
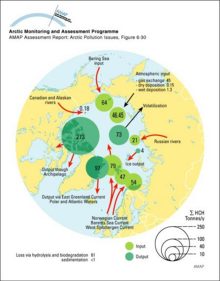
Sum-HCH budget for the Arctic Ocean (tonnes/y)
|
|
|
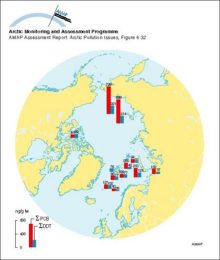
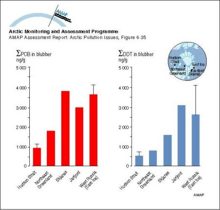
Sum-PCB and sum-DDT (ng/g lw) in Arctic cod liver, 1994-95
|
|
|
PCB and toxaphene (ng/g ww) in zooplankton from the transpolar cruise of the Arctic Ocean, July-September 1994
|
|
|
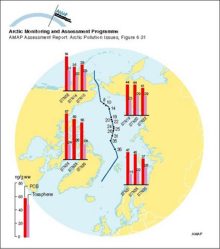
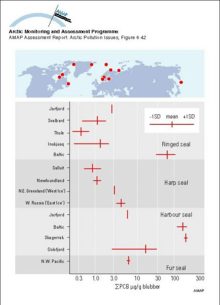
Geographical trends of PCB and DDT in harp seals from Arctic waters Vertical bars represent arithmetic means ± SD of combined results for males and females The SD has been estimated from the range in [..]
|
|
|
Distribution of organochlorine contaminants (OCs) in Arctic air, snow, seawater, and the marine mammals food chain Data for the six major classes of OCs are plotted for each compartment or species as [..]
|

|
|
Comparison of sum-PCB concentrations in seal blubber from various Arctic regions with results from the same species in temperate waters Vertical bars represent means and the horizontal bars the [..]
|
|
|
Temporal trends in OC levels (ng/g lw) in reindeer from Abisko, Sweden Levels are usually based on a pool of 10 samples
|

|
|
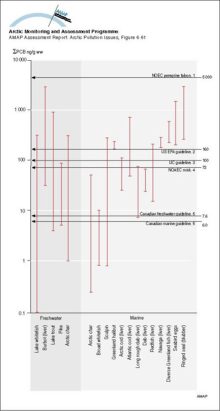
Sum-PCB (ng/g ww) in Arctic animals as food items compared to no-effect-concentrations (NOAEC) and environmental quality guidelines for protecting fish-eating/aquatic wildlife (1 Baril et al 1990, 2 [..]
|
|
|
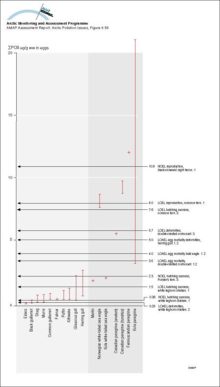
Concentrations of sum-PCB (µg/g ww) in Arctic bird eggs compared to thresholds for avian effects (1 Barron et al 1995, 2 Giesy et al 1994b, 3 Bosveld and Van den Berg 1994)
|
|
|
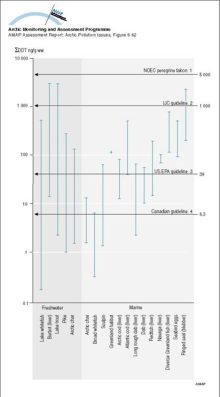
Sum-DDT (ng/g ww) in Arctic animals as food items compared to no-effect-concentrations (NOAEC) and environmental quality guidelines for protecting fish-eating/aquatic wildlife (1 Baril et al 1990, 2 [..]
|
|
|
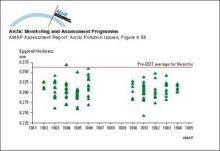
Shell thickness (mm) of peregrine falcon eggs representing 109 clutches produced in Rankin Inlet, NWT, Canada from 1981 to 1986 and from 1990 to 1994
|
|
|
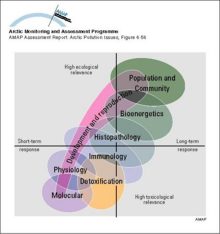
The relationship between response levels of biological organization and the toxicological relevance and time scale of responses
|
|
|
Temporal trends in concentrations of sum-HCH and toxaphene in Arctic air
|

|

water OR waste searches for either of these words
oceans AND biodiversity searches for blocks with both words
pollution NEAR water searches for blocks with either of these words, with them being closer ranks higher
"climate change" searches for this phrase