Your query returned 155 graphics.
Results 1 - 15
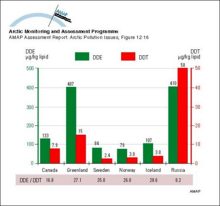
Mean maternal plasma lipid concentrations of DDE and DDT; figures below the graph show the DDE/DDT ratiosMean maternal plasma lipid concentrations of DDE and DDT; figures below the graph show the DDE/DDT ratios |
|
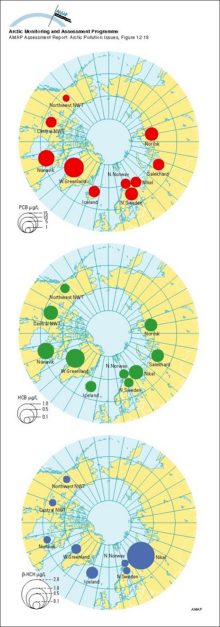
Geometric mean concentrations of PCB, HCB and B-HCH in maternal blood plasma; AMAP circumpolar study 1995, see Table 12A12Geometric mean concentrations of PCB, HCB and B-HCH in maternal blood plasma; AMAP circumpolar study 1995, see Table 12A12 |
|
Time trends of mean methylmercury concentrationsTime trends of mean methylmercury concentrations |

|
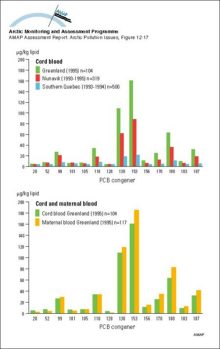
PCB congener profiles in cord blood of Canadian and Greenlandic population groups, and in cord and maternal blood from GreenlandPCB congener profiles in cord blood of Canadian and Greenlandic population groups, and in cord and maternal blood from Greenland |
|
Trends in concentration of major organochlorines in blubber of female ringed seals over 6 to 10 years at 3 sites in the eastern Canadian Arctic (N=10-14 animals for each year/site)Trends in concentration of major organochlorines in blubber of female ringed seals over 6 to 10 years at 3 sites in the eastern Canadian Arctic (N=10-14 animals for each year/site) |

|
Migration patterns of four main stocks of eider ducks from the Canadian Arctic Organochlorines in the same four stocksMigration patterns of four main stocks of eider ducks from the Canadian Arctic Organochlorines in the same four stocks |
|
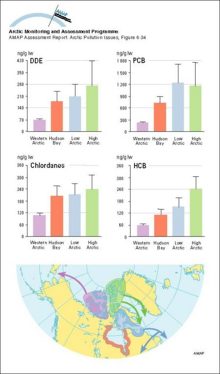
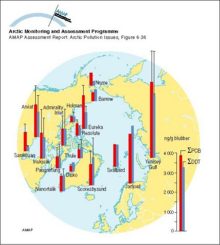
Sum-PCB and sum-DDT in ringed seal blubber (µg/g) Vertical bars denote standard deviationSum-PCB and sum-DDT in ringed seal blubber (µg/g) Vertical bars denote standard deviation |
|
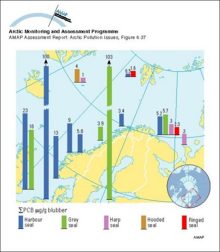
Sum-PCB levels in pinnipeds in NorwaySum-PCB levels in pinnipeds in Norway |
|
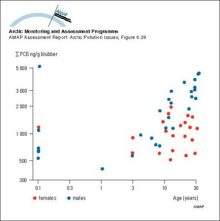
Variation of PCB with age in blubber of ringed seals (western Hudson Bay, Canada) A total of 24 females and 30 males were analyzedVariation of PCB with age in blubber of ringed seals (western Hudson Bay, Canada) A total of 24 females and 30 males were analyzed |
|
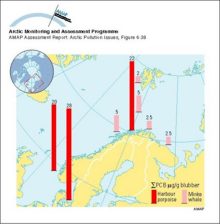
Sum-PCB levels in cetaceans in NorwaySum-PCB levels in cetaceans in Norway |
|
Correlations between concentrations (lw) of major persistent OCs and trophic level in the marine food web for Svalbard and Lancaster Sound Trophic level data were assigned based on Hobson and Welch (1992)Correlations between concentrations (lw) of major persistent OCs and trophic level in the marine food web for Svalbard and Lancaster Sound Trophic level data were assigned based on Hobson and Welch [..] |

|
Distribution of organochlorine contaminants (OCs) in Arctic air, snow, seawater, and the marine mammals food chain Data for the six major classes of OCs are plotted for each compartment or species as the percent ofDistribution of organochlorine contaminants (OCs) in Arctic air, snow, seawater, and the marine mammals food chain Data for the six major classes of OCs are plotted for each compartment or species as [..] |

|
Concentrations of sum-HCH in Arctic airConcentrations of sum-HCH in Arctic air |

|
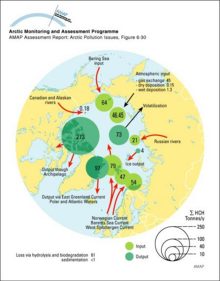
Sum-HCH budget for the Arctic Ocean (tonnes/y)Sum-HCH budget for the Arctic Ocean (tonnes/y) |
|
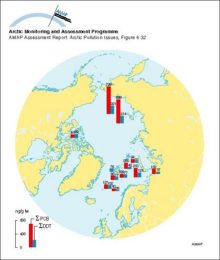
Sum-PCB and sum-DDT (ng/g lw) in Arctic cod liver, 1994-95Sum-PCB and sum-DDT (ng/g lw) in Arctic cod liver, 1994-95 |
|

water OR waste searches for either of these words
oceans AND biodiversity searches for blocks with both words
pollution NEAR water searches for blocks with either of these words, with them being closer ranks higher
"climate change" searches for this phrase