Your query returned 85 graphics.
Results 1 - 15
Distribution of radioactivity (PCi/L) in the surface layer of the ocean after ten years of simulation of Preller's model Source locations are the Ob, Yenisey and Pechora Rivers, as well as SellafieldDistribution of radioactivity (PCi/L) in the surface layer of the ocean after ten years of simulation of Preller's model Source locations are the Ob, Yenisey and Pechora Rivers, as well as Sellafield |

|
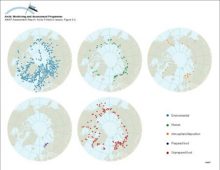
Geographical distribution of sample information in the AMAP radioactivity databaseGeographical distribution of sample information in the AMAP radioactivity database |
|
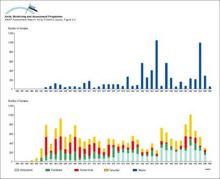
Available data in the AMAP radioactivity database as a function of timeAvailable data in the AMAP radioactivity database as a function of time |
|
Ranges and average values of 137Cs activity concentrations in food products, from data in the AMAP radioactivity databaseRanges and average values of 137Cs activity concentrations in food products, from data in the AMAP radioactivity database |

|
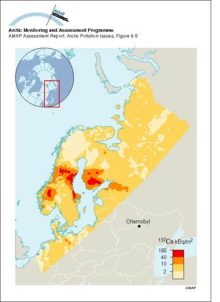
Ground deposition of 137Cs from the Chernoybl accident (values normalised to May 10, 1986)Ground deposition of 137Cs from the Chernoybl accident (values normalised to May 10, 1986) |
|
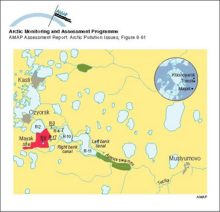
The system of dams and drainage channels at MayakThe system of dams and drainage channels at Mayak |
|
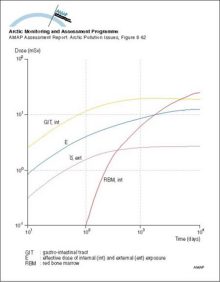
Dose accumulation in adult rural residents after the Kyshtym accident in 1957Dose accumulation in adult rural residents after the Kyshtym accident in 1957 |
|
Photograph of a submarine being provided with cooling water from a supply shipPhotograph of a submarine being provided with cooling water from a supply ship |
|
(a) Critical loads of acidity expressed as sulfur (5th percentile presented for each grid) for lakes in northern Fennoscandia and surface waters on Svalbard, and (b) their exceedance (95th percentile)(a) Critical loads of acidity expressed as sulfur (5th percentile presented for each grid) for lakes in northern Fennoscandia and surface waters on Svalbard, and (b) their exceedance (95th percentile) |

|
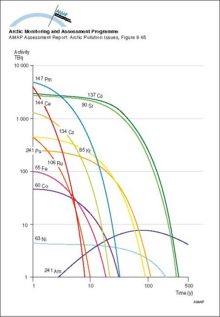
The changing inventory of major radionuclides in the Komsomolets reactor with timeThe changing inventory of major radionuclides in the Komsomolets reactor with time |
|
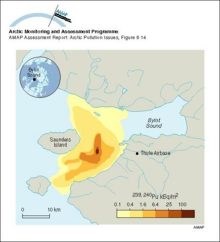
Activity concentrations of 239,240Pu in sediments near Thule, GreenlandActivity concentrations of 239,240Pu in sediments near Thule, Greenland |
|
Some of the dumped containers in Stepovogo BaySome of the dumped containers in Stepovogo Bay |
|
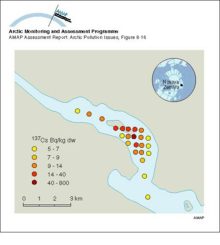
Activity concentrations of 137Cs in sediments of Stepovogo BayActivity concentrations of 137Cs in sediments of Stepovogo Bay |
|
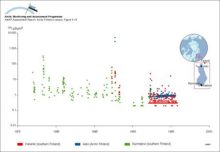
Changes with time in 131I activity concentration in Finnish air samplesChanges with time in 131I activity concentration in Finnish air samples |
|
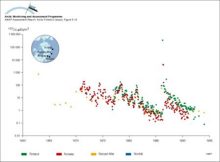
Changes with time in 137Cs activity concentration in air in Norway, Finland and RussiaChanges with time in 137Cs activity concentration in air in Norway, Finland and Russia |
|

water OR waste searches for either of these words
oceans AND biodiversity searches for blocks with both words
pollution NEAR water searches for blocks with either of these words, with them being closer ranks higher
"climate change" searches for this phrase