Your query returned 203 graphics.
Results 1 - 15
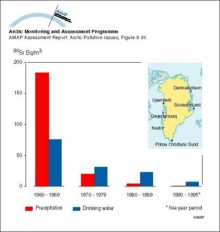
Ten-year averages of 90Sr activity concentrations in drinking water and precipitation in GreenlandTen-year averages of 90Sr activity concentrations in drinking water and precipitation in Greenland |
|
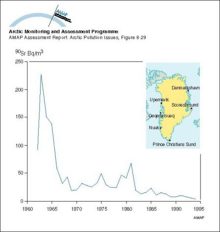
Changes with time in average activity concentration of 90Sr in drinking water in GreenlandChanges with time in average activity concentration of 90Sr in drinking water in Greenland |
|
Time trends of mean methylmercury concentrationsTime trends of mean methylmercury concentrations |

|
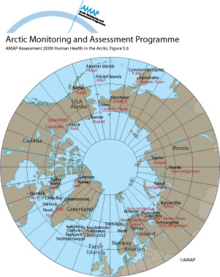
Human health study locations in Arctic Norway, Russia and Finland; red dots indicate the main communities studied under the AMAP monitoring programmeHuman health study locations in Arctic Norway, Russia and Finland; red dots indicate the main communities studied under the AMAP monitoring programme |
|
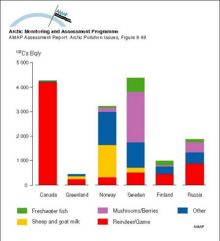
The relative contribution to the 137Cs content of the diet of the ‘average’ population of various Arctic areas for the period 1990 to 1994The relative contribution to the 137Cs content of the diet of the ‘average’ population of various Arctic areas for the period 1990 to 1994 |
|
The relative contribution to the 137Cs content of the diet of the ‘selected’ population of various Arctic areas for the period 1990 to 1994The relative contribution to the 137Cs content of the diet of the ‘selected’ population of various Arctic areas for the period 1990 to 1994 |
|
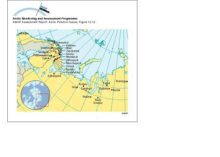
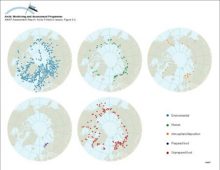
Geographical distribution of sample information in the AMAP radioactivity databaseGeographical distribution of sample information in the AMAP radioactivity database |
|
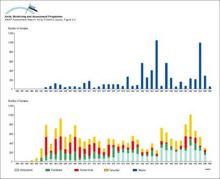
Available data in the AMAP radioactivity database as a function of timeAvailable data in the AMAP radioactivity database as a function of time |
|
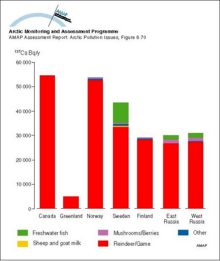
Ranges and average values of 137Cs activity concentrations in food products, from data in the AMAP radioactivity databaseRanges and average values of 137Cs activity concentrations in food products, from data in the AMAP radioactivity database |

|
Distribution of radioactivity (PCi/L) in the surface layer of the ocean after ten years of simulation of Preller's model Source locations are the Ob, Yenisey and Pechora Rivers, as well as SellafieldDistribution of radioactivity (PCi/L) in the surface layer of the ocean after ten years of simulation of Preller's model Source locations are the Ob, Yenisey and Pechora Rivers, as well as Sellafield |

|
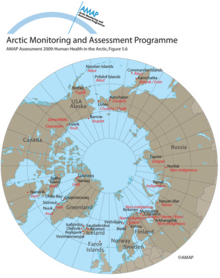
Locations and ethnicity of populations included in AMAP human health studiesLocations and ethnicity of populations included in AMAP human health studies |
|
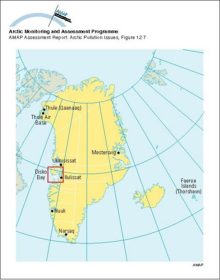
Human health study locations in Greenland and the Faeroe Islands; Disko Bay was the main area studied under the AMAP monitoring programme (1994-96)Human health study locations in Greenland and the Faeroe Islands; Disko Bay was the main area studied under the AMAP monitoring programme (1994-96) |
|
Locations and ethnicity of populations included in AMAP human health studiesLocations and ethnicity of populations included in AMAP human health studies |
|
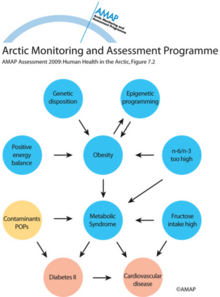
Genetic and environmental factors increase in concert the susceptibility of an individual for public health problems such as, type II diabetes and metabolic syndromeGenetic and environmental factors increase in concert the susceptibility of an individual for public health problems such as, type II diabetes and metabolic syndrome. All these conditions may have [..] |
|
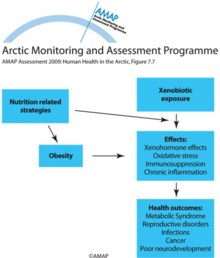
Potential methods for improving public healthPotential methods for improving public health |
|

water OR waste searches for either of these words
oceans AND biodiversity searches for blocks with both words
pollution NEAR water searches for blocks with either of these words, with them being closer ranks higher
"climate change" searches for this phrase