Your query returned 120 graphics.
Results 16 - 30
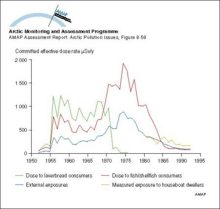
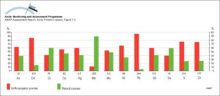
Comparison of doses to critical groups for Sellafield discharges from 1952 to 1993Comparison of doses to critical groups for Sellafield discharges from 1952 to 1993 |
|
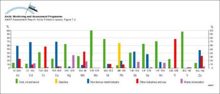
Seawater concentrations of 137Cs in the Barents and East Greenland Seas compared to the yearly releases from SellafieldSeawater concentrations of 137Cs in the Barents and East Greenland Seas compared to the yearly releases from Sellafield |

|
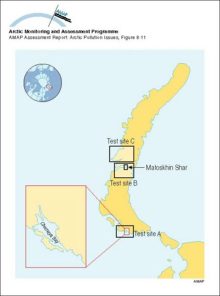
Nuclear weapons test sites on Novaya ZemlyaNuclear weapons test sites on Novaya Zemlya |
|
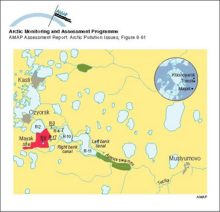
The system of dams and drainage channels at MayakThe system of dams and drainage channels at Mayak |
|
Dose accumulation in adult rural residents after the Kyshtym accident in 1957Dose accumulation in adult rural residents after the Kyshtym accident in 1957 |
|
Photograph of a submarine being provided with cooling water from a supply shipPhotograph of a submarine being provided with cooling water from a supply ship |

|
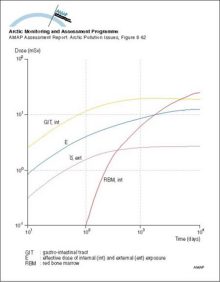
Predicted release rates of different radionuclide groups from the submarine reactor dumped in the Novaya Zemlya Trough (best estimate scenario)Predicted release rates of different radionuclide groups from the submarine reactor dumped in the Novaya Zemlya Trough (best estimate scenario) |

|
Locations of sea dumping of radioactive waste in the Russian ArcticLocations of sea dumping of radioactive waste in the Russian Arctic |

|
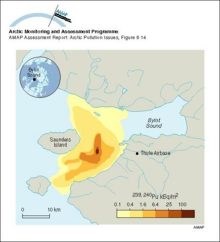
Activity concentrations of 239,240Pu in sediments near Thule, GreenlandActivity concentrations of 239,240Pu in sediments near Thule, Greenland |
|
Some of the dumped containers in Stepovogo BaySome of the dumped containers in Stepovogo Bay |
|
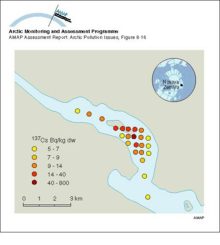
Activity concentrations of 137Cs in sediments of Stepovogo BayActivity concentrations of 137Cs in sediments of Stepovogo Bay |
|
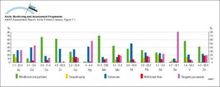
Global emissions of trace metals to the atmosphere from natural sources Numbers under the columns are the range of estimates of the emissions in thousands of tonnes per yearGlobal emissions of trace metals to the atmosphere from natural sources Numbers under the columns are the range of estimates of the emissions in thousands of tonnes per year |
|
Spatial distribution of emissions of Pb within the 150 km x 150 km EMEP grid system for the area north of latitude 50° N in 1989Spatial distribution of emissions of Pb within the 150 km x 150 km EMEP grid system for the area north of latitude 50° N in 1989 |

|
Comparison of global emissions of trace metals to the atmosphere from natural and anthropogenic sources in 1983 Numbers under the columns are the median values of estimates of total emissions in thousands of tonnes per yearComparison of global emissions of trace metals to the atmosphere from natural and anthropogenic sources in 1983 Numbers under the columns are the median values of estimates of total emissions in [..] |
|
Global emissions of trace metals to the atmosphere at the beginning of the 1980s from anthropogenic sourcesGlobal emissions of trace metals to the atmosphere at the beginning of the 1980s from anthropogenic sources |
|

water OR waste searches for either of these words
oceans AND biodiversity searches for blocks with both words
pollution NEAR water searches for blocks with either of these words, with them being closer ranks higher
"climate change" searches for this phrase