|
(a) Vertical distribution of SOx (SO2 + SO42-) concentrations averaged over the area north of 75°N, and (b) contributions from the different sources
|

|
|
Model calculations of sulfur deposition and fraction of dry deposition for the period July 1990 to June 1991 in northern Fennoscandia and the Kola Peninsula
|

|
|
(a) The contribution from the different sources to the total deposition, averaged over the area north of 75°N from October 1990 to May 1994, (b) the calculated total monthly depositions of SOx [..]
|

|
|
Vertical distribution of Arctic haze in summer, winter, and the whole year Sulfur air concentrations and relative source-contribution (%) for different heights above the ground are shown The [..]
|

|
|
(a) Critical loads of acidity expressed as sulfur (5th percentile presented for each grid) for lakes in northern Fennoscandia and surface waters on Svalbard, and (b) their exceedance (95th percentile)
|

|
|
Body burdens of radiocaesium (yearly averages) across the Canadian Arctic
|

|
|
Yearly and depth-averaged concentrations (Bq/m3) of 137Cs after 6 years from Harms' model The sources are instantaneous releases of 1 PBq from the dump sites in Abrosimov Bay, Stepovogo Bay, Tsivolky [..]
|

|
|
Transport of 90Sr, originating from Sellafield, along the coast of Norway The highest values are found in the Norwegian Coastal Current and decrease northward
|

|
|
Changes with time in 131I activity concentration in Finnish air samples
|
|
|
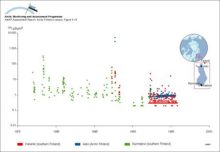
Changes with time in 137Cs activity concentration in air in Norway, Finland and Russia
|
|
|
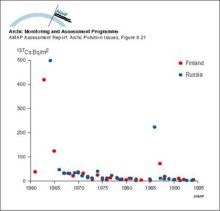
Changes with time in wet and dry deposition of 137Cs in Arctic Finland and north west Russia (Nenets Autonomous Okrug)
|
|
|
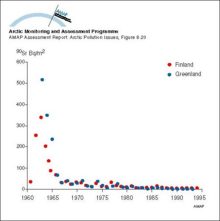
Changes with time in wet and dry deposition of 90Sr in Arctic Finland and Greenland
|
|
|
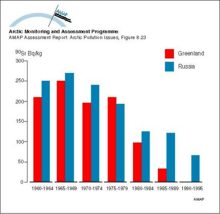
Changes with time in 90Sr activity concentration (5-year means) in lichens in Greenland and Russia
|
|
|
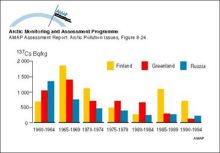
Changes with time in 137Cs activity concentrations (5-year means) in lichens in Arctic Finland, Greenland, and Russia
|
|
|
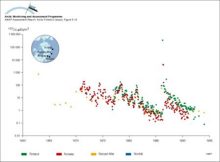
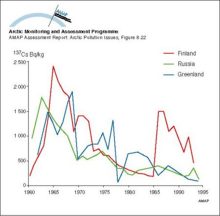
Changes with time in 137Cs activity concentration in lichen from Arctic Finland, north west Russia, and Greenland
|
|

water OR waste searches for either of these words
oceans AND biodiversity searches for blocks with both words
pollution NEAR water searches for blocks with either of these words, with them being closer ranks higher
"climate change" searches for this phrase