Your query returned 117 graphics.
Results 91 - 105
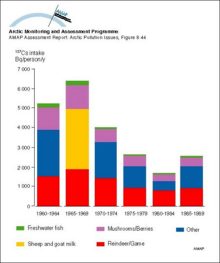
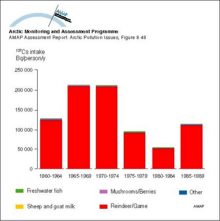
Yearly intake of 137Cs from various dietary components by the average population of Arctic RussiaYearly intake of 137Cs from various dietary components by the average population of Arctic Russia |
|
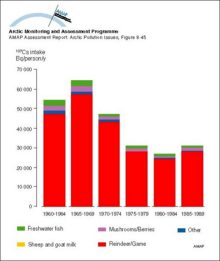
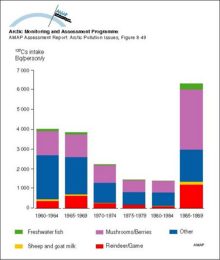
Yearly intake of 137Cs from various dietary components by the ‘selected’ population of eastern Arctic RussiaYearly intake of 137Cs from various dietary components by the ‘selected’ population of eastern Arctic Russia |
|
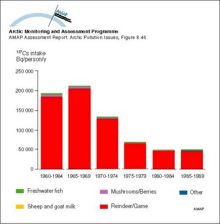
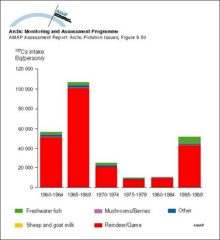
Yearly intake of 137Cs from various dietary components by the ‘selected’ population of western Arctic RussiaYearly intake of 137Cs from various dietary components by the ‘selected’ population of western Arctic Russia |
|
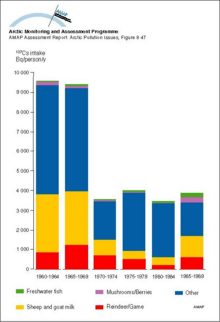
Yearly intake of 137Cs from various dietary components by the average population of Arctic NorwayYearly intake of 137Cs from various dietary components by the average population of Arctic Norway |
|
Yearly intake of 137Cs from various dietary components by the ‘selected’ population of Arctic NorwayYearly intake of 137Cs from various dietary components by the ‘selected’ population of Arctic Norway |
|
Yearly intake of 137Cs from various dietary components by the average population of Arctic SwedenYearly intake of 137Cs from various dietary components by the average population of Arctic Sweden |
|
Yearly intake of 137Cs from various dietary components by the ‘selected’ population of Arctic SwedenYearly intake of 137Cs from various dietary components by the ‘selected’ population of Arctic Sweden |
|
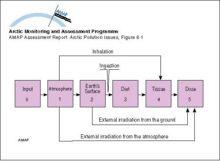
Compartment model used to assess doses from releases of radioactive materials to the atmosphere from nuclear testingCompartment model used to assess doses from releases of radioactive materials to the atmosphere from nuclear testing |
|
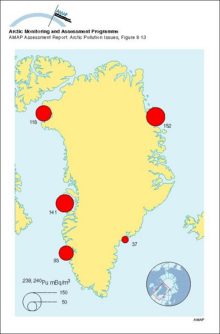
Concentrations of 239,240Pu in seawater around Greenland, 1968Concentrations of 239,240Pu in seawater around Greenland, 1968 |
|
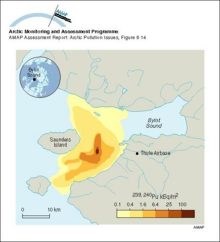
Activity concentrations of 239,240Pu in sediments near Thule, GreenlandActivity concentrations of 239,240Pu in sediments near Thule, Greenland |
|
Temporal variation in calculated reindeer Tag values for different Arctic regionsTemporal variation in calculated reindeer Tag values for different Arctic regions |

|
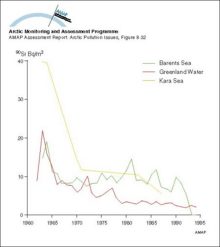
Changes with time in 90Sr activity concentrations in surface seawater from Greenland waters and the Barents and Kara SeasChanges with time in 90Sr activity concentrations in surface seawater from Greenland waters and the Barents and Kara Seas |
|
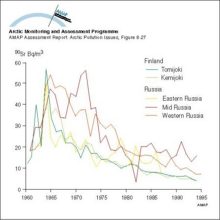
Changes with time in activity concentration of 90Sr in Russian and Finnish riversChanges with time in activity concentration of 90Sr in Russian and Finnish rivers |
|
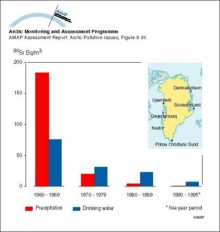
Ten-year averages of 90Sr activity concentrations in drinking water and precipitation in GreenlandTen-year averages of 90Sr activity concentrations in drinking water and precipitation in Greenland |
|
Photograph of a submarine being provided with cooling water from a supply shipPhotograph of a submarine being provided with cooling water from a supply ship |

|

water OR waste searches for either of these words
oceans AND biodiversity searches for blocks with both words
pollution NEAR water searches for blocks with either of these words, with them being closer ranks higher
"climate change" searches for this phrase