Your query returned 118 graphics.
Results 106 - 118
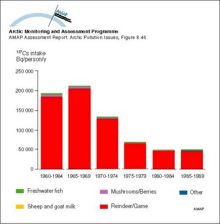
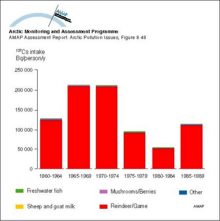
Yearly intake of 137Cs from various dietary components by the average population of Arctic CanadaYearly intake of 137Cs from various dietary components by the average population of Arctic Canada |
|
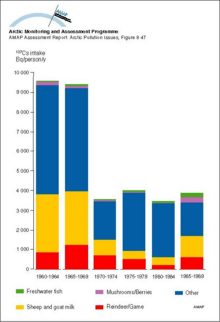
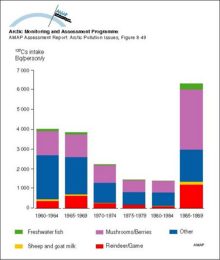
Yearly intake of 137Cs from various dietary components by the ‘selected’ population of Arctic CanadaYearly intake of 137Cs from various dietary components by the ‘selected’ population of Arctic Canada |
|
Yearly intake of 137Cs from various dietary components by the average population of Arctic RussiaYearly intake of 137Cs from various dietary components by the average population of Arctic Russia |
|
Yearly intake of 137Cs from various dietary components by the ‘selected’ population of eastern Arctic RussiaYearly intake of 137Cs from various dietary components by the ‘selected’ population of eastern Arctic Russia |
|
Yearly intake of 137Cs from various dietary components by the ‘selected’ population of western Arctic RussiaYearly intake of 137Cs from various dietary components by the ‘selected’ population of western Arctic Russia |
|
Yearly intake of 137Cs from various dietary components by the average population of Arctic NorwayYearly intake of 137Cs from various dietary components by the average population of Arctic Norway |
|
Yearly intake of 137Cs from various dietary components by the ‘selected’ population of Arctic NorwayYearly intake of 137Cs from various dietary components by the ‘selected’ population of Arctic Norway |
|
Yearly intake of 137Cs from various dietary components by the average population of Arctic SwedenYearly intake of 137Cs from various dietary components by the average population of Arctic Sweden |
|
Yearly intake of 137Cs from various dietary components by the ‘selected’ population of Arctic SwedenYearly intake of 137Cs from various dietary components by the ‘selected’ population of Arctic Sweden |
|
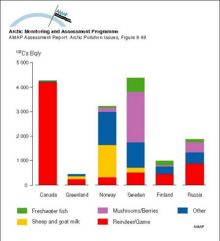
The relative contribution to the 137Cs content of the diet of the ‘average’ population of various Arctic areas for the period 1990 to 1994The relative contribution to the 137Cs content of the diet of the ‘average’ population of various Arctic areas for the period 1990 to 1994 |
|
Transport of 90Sr, originating from Sellafield, along the coast of Norway The highest values are found in the Norwegian Coastal Current and decrease northwardTransport of 90Sr, originating from Sellafield, along the coast of Norway The highest values are found in the Norwegian Coastal Current and decrease northward |

|
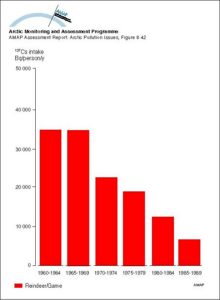
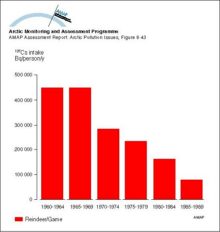
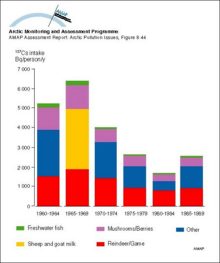
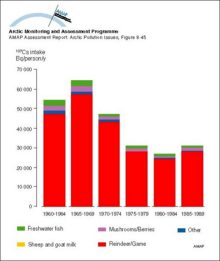
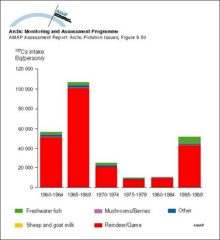
Body burdens of radiocaesium (yearly averages) across the Canadian ArcticBody burdens of radiocaesium (yearly averages) across the Canadian Arctic |

|
Yearly and depth-averaged concentrations (Bq/m3) of 137Cs after 6 years from Harms' model The sources are instantaneous releases of 1 PBq from the dump sites in Abrosimov Bay, Stepovogo Bay, Tsivolky Bay, and Novaya Zemlya TroughYearly and depth-averaged concentrations (Bq/m3) of 137Cs after 6 years from Harms' model The sources are instantaneous releases of 1 PBq from the dump sites in Abrosimov Bay, Stepovogo Bay, Tsivolky [..] |

|

water OR waste searches for either of these words
oceans AND biodiversity searches for blocks with both words
pollution NEAR water searches for blocks with either of these words, with them being closer ranks higher
"climate change" searches for this phrase