Your query returned 92 graphics.
Results 1 - 15
Distribution of radioactivity (PCi/L) in the surface layer of the ocean after ten years of simulation of Preller's model Source locations are the Ob, Yenisey and Pechora Rivers, as well as SellafieldDistribution of radioactivity (PCi/L) in the surface layer of the ocean after ten years of simulation of Preller's model Source locations are the Ob, Yenisey and Pechora Rivers, as well as Sellafield |

|
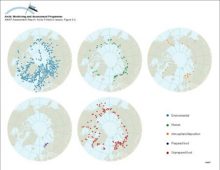
Geographical distribution of sample information in the AMAP radioactivity databaseGeographical distribution of sample information in the AMAP radioactivity database |
|
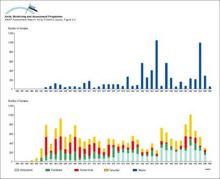
Available data in the AMAP radioactivity database as a function of timeAvailable data in the AMAP radioactivity database as a function of time |
|
Ranges and average values of 137Cs activity concentrations in food products, from data in the AMAP radioactivity databaseRanges and average values of 137Cs activity concentrations in food products, from data in the AMAP radioactivity database |

|
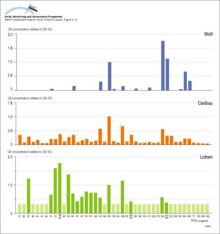
Relative tissue concentrations of organochlorine compounds detected in lichen, and in adipose tissue of caribou and wolf at three locations in the Northwest Territories, CanadaRelative tissue concentrations of organochlorine compounds detected in lichen, and in adipose tissue of caribou and wolf at three locations in the Northwest Territories, Canada |

|
Observed and predicted organochlorine concentrations (ng/g ww) in caribou and reindeer (Rangifer tarandus) liver All data are presented in, or were derived from data in Annex Table 6A4Observed and predicted organochlorine concentrations (ng/g ww) in caribou and reindeer (Rangifer tarandus) liver All data are presented in, or were derived from data in Annex Table 6A4 |
|
Concentrations of PCB congeners relative to PCB congener 153 for lichen, caribou, and wolf in the Bathurst herd, Canada The light bars denote that the congener was not detectedConcentrations of PCB congeners relative to PCB congener 153 for lichen, caribou, and wolf in the Bathurst herd, Canada The light bars denote that the congener was not detected |
|
Temporal trends in OC levels (ng/g lw) in reindeer from Abisko, Sweden Levels are usually based on a pool of 10 samplesTemporal trends in OC levels (ng/g lw) in reindeer from Abisko, Sweden Levels are usually based on a pool of 10 samples |

|
Temporal trends in PCB and DDT levels (µg/g lw ± 95% confidence limits) of otter muscle in Sweden Levels are based on means of 26, 16, and 28 samples (northern Sweden) and 29, 9, and 15 samples (southern Sweden)Temporal trends in PCB and DDT levels (µg/g lw ± 95% confidence limits) of otter muscle in Sweden Levels are based on means of 26, 16, and 28 samples (northern Sweden) and 29, 9, and 15 samples [..] |

|
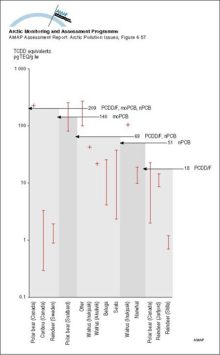
Body concentrations of PCDD/F and non-ortho and mono-ortho PCBs as TCDD equivalents (pg/g lw) in Arctic mammals compared to thresholds for immunosuppression in harbor seal for the same combinations of substances analyzedBody concentrations of PCDD/F and non-ortho and mono-ortho PCBs as TCDD equivalents (pg/g lw) in Arctic mammals compared to thresholds for immunosuppression in harbor seal for the same combinations of [..] |
|
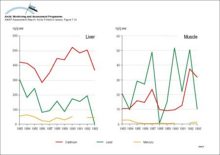
Changes with time in concentrations of Cd, Pb and Hg in liver and muscle tissue of reindeer (Rangifer tarandus) sampled in three districts in eastern SwedenChanges with time in concentrations of Cd, Pb and Hg in liver and muscle tissue of reindeer (Rangifer tarandus) sampled in three districts in eastern Sweden |
|
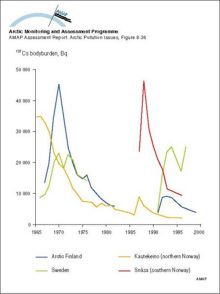
Changes with time in 137Cs wholebody measurements of reindeer herders in northern and central Norway, Arctic Finland, and SwedenChanges with time in 137Cs wholebody measurements of reindeer herders in northern and central Norway, Arctic Finland, and Sweden |
|
Changes with time in 137Cs contamination in the food chain lichen - reindeer - humansChanges with time in 137Cs contamination in the food chain lichen - reindeer - humans |

|
Temporal variation in calculated reindeer Tag values for different Arctic regionsTemporal variation in calculated reindeer Tag values for different Arctic regions |

|
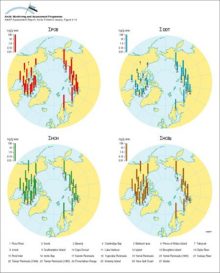
Spatial trends in the net flux from reindeer meat in different Arctic areas, for the first year after an assumed uniform deposition of 100 kBq/m2Spatial trends in the net flux from reindeer meat in different Arctic areas, for the first year after an assumed uniform deposition of 100 kBq/m2 |

|

water OR waste searches for either of these words
oceans AND biodiversity searches for blocks with both words
pollution NEAR water searches for blocks with either of these words, with them being closer ranks higher
"climate change" searches for this phrase