|
Concentrations, as geometric means, of major organochlorine groups in burbot liver at Fort Good Hope, NWT, Canada (1986-94) Vertical bars denote standard errors
|

|
|
Temporal trends in levels of PCB, DDT, alpha-HCH, and HCB in muscle from Lake Storvindeln pike and Lake Abiskojaure char in Sweden Mean levels (µg/g lw) and 95% confidence intervals of the mean are [..]
|

|
|
Temporal trends in PCB and DDE levels in Arctic seabird eggs from Prince Leopold Island, Canada (1975-1993)
|

|
|
Levels of PCB congeners and PCDD/Fs (ng/g lw) in Lake Storvindeln pike muscle between 1968 and 1992
|

|
|
Temporal trends of sum-PCB and sum-DDT in blubber of female ringed seals from Holman Island in the western Canadian Arctic Vertical bars represent one SD
|

|
|
Trends in sum-PCB, sum-DDT, sum-CHL, and toxaphene over a ten year period (20 years for DDT in the Mackenzie Delta) for male narwhal and beluga blubber samples from the Canadian Arctic (N=8-26)
|

|
|
Trends in concentration of major organochlorines in blubber of female ringed seals over 6 to 10 years at 3 sites in the eastern Canadian Arctic (N=10-14 animals for each year/site)
|

|
|
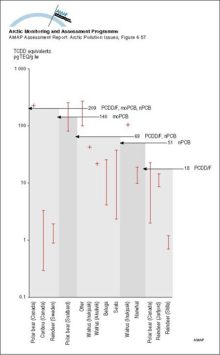
Body concentrations of PCDD/F and non-ortho and mono-ortho PCBs as TCDD equivalents (pg/g lw) in Arctic mammals compared to thresholds for immunosuppression in harbor seal for the same combinations of [..]
|
|
|
Lower tropospheric Arctic temperature trends (°C per decade, January 1979 to February 1996), as monitored by MSUs on polar orbiting satellites
|

|
|
Dose estimates based on wholebody measurements (see Figure 836) for two groups (northern Saami and southern Saami) of Norwegian reindeer-breeding Saami
|

|
|
Predicted release rates of different radionuclide groups from the submarine reactor dumped in the Novaya Zemlya Trough (best estimate scenario)
|

|
|
Changes with time in 137Cs contamination in the food chain lichen - reindeer - humans
|

|
|
Temporal variation in calculated reindeer Tag values for different Arctic regions
|

|
|
Spatial trends in the net flux from reindeer meat in different Arctic areas, for the first year after an assumed uniform deposition of 100 kBq/m2
|

|
|
Temporal variation in cow milk Tag values for Sweden, Norway and Finland
|

|

water OR waste searches for either of these words
oceans AND biodiversity searches for blocks with both words
pollution NEAR water searches for blocks with either of these words, with them being closer ranks higher
"climate change" searches for this phrase