Your query returned 125 graphics.
Results 46 - 60
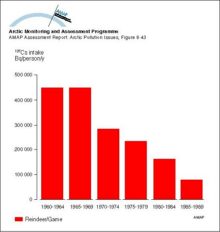
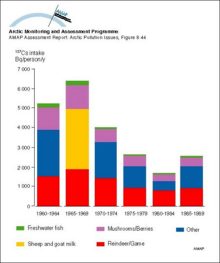
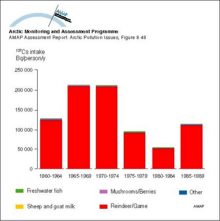
Yearly intake of 137Cs from various dietary components by the ‘selected’ population of GreenlandYearly intake of 137Cs from various dietary components by the ‘selected’ population of Greenland |
|
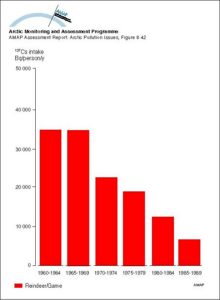
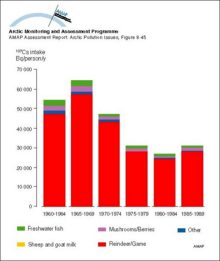
Yearly intake of 137Cs from various dietary components by the average population of GreenlandYearly intake of 137Cs from various dietary components by the average population of Greenland |
|
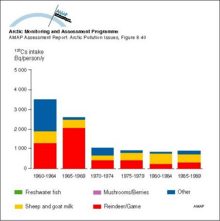
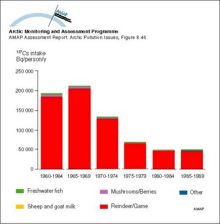
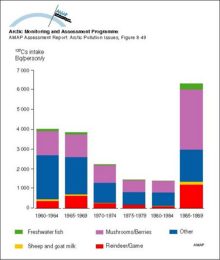
Yearly intake of 137Cs from various dietary components by the average population of Arctic CanadaYearly intake of 137Cs from various dietary components by the average population of Arctic Canada |
|
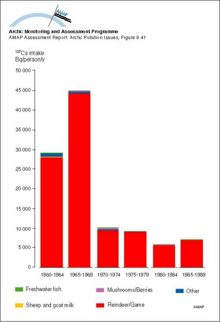
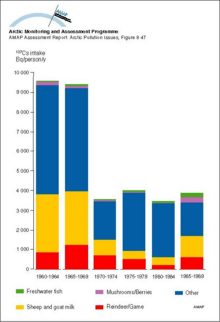
Yearly intake of 137Cs from various dietary components by the ‘selected’ population of Arctic CanadaYearly intake of 137Cs from various dietary components by the ‘selected’ population of Arctic Canada |
|
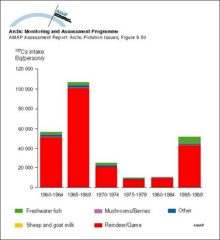
Yearly intake of 137Cs from various dietary components by the average population of Arctic RussiaYearly intake of 137Cs from various dietary components by the average population of Arctic Russia |
|
Yearly intake of 137Cs from various dietary components by the ‘selected’ population of eastern Arctic RussiaYearly intake of 137Cs from various dietary components by the ‘selected’ population of eastern Arctic Russia |
|
Yearly intake of 137Cs from various dietary components by the ‘selected’ population of western Arctic RussiaYearly intake of 137Cs from various dietary components by the ‘selected’ population of western Arctic Russia |
|
Yearly intake of 137Cs from various dietary components by the average population of Arctic NorwayYearly intake of 137Cs from various dietary components by the average population of Arctic Norway |
|
Yearly intake of 137Cs from various dietary components by the ‘selected’ population of Arctic NorwayYearly intake of 137Cs from various dietary components by the ‘selected’ population of Arctic Norway |
|
Yearly intake of 137Cs from various dietary components by the average population of Arctic SwedenYearly intake of 137Cs from various dietary components by the average population of Arctic Sweden |
|
Yearly intake of 137Cs from various dietary components by the ‘selected’ population of Arctic SwedenYearly intake of 137Cs from various dietary components by the ‘selected’ population of Arctic Sweden |
|
Changes with time in 137Cs contamination in the food chain lichen - reindeer - humansChanges with time in 137Cs contamination in the food chain lichen - reindeer - humans |

|
Temporal variation in calculated reindeer Tag values for different Arctic regionsTemporal variation in calculated reindeer Tag values for different Arctic regions |

|
Temporal trends in OC levels (ng/g lw) in reindeer from Abisko, Sweden Levels are usually based on a pool of 10 samplesTemporal trends in OC levels (ng/g lw) in reindeer from Abisko, Sweden Levels are usually based on a pool of 10 samples |

|
Deposition of PCBs, as mono/di/trichloro- and tetra-nonachlorobiphenyls) in snow cores from the Agassiz Ice Cap (northern Ellesmere Island, Canada) Combined light and dark shaded sections of each bar indicate sum-PCB fluxDeposition of PCBs, as mono/di/trichloro- and tetra-nonachlorobiphenyls) in snow cores from the Agassiz Ice Cap (northern Ellesmere Island, Canada) Combined light and dark shaded sections of each bar [..] |

|

water OR waste searches for either of these words
oceans AND biodiversity searches for blocks with both words
pollution NEAR water searches for blocks with either of these words, with them being closer ranks higher
"climate change" searches for this phrase