|
Ranges and average values of 137Cs activity concentrations in food products, from data in the AMAP radioactivity database
|

|
|
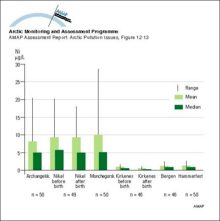
Nickel levels in urine from pregnant and delivering women in different areas of Russia and Norway
|
|
|
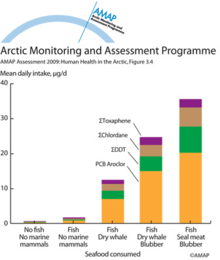
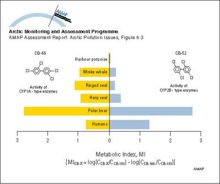
Daily intake of POPs in 90 daily food portions as a function of seafood types present in the diet
|
|
|
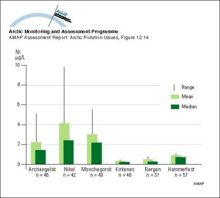
Nickel levels in urine from newborn children in different areas of Russia and Norway
|
|
|
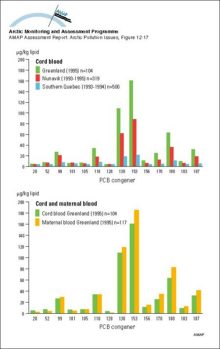
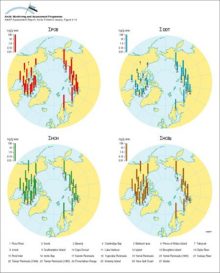
PCB congener profiles in cord blood of Canadian and Greenlandic population groups, and in cord and maternal blood from Greenland
|
|
|
Cytochrome P450 1A (CYP1A) and cytochrome P4502B (CYP2B) type enzyme activities in some Arctic marine mammals and humans using the metabolic index (MI) suggested by Tanabe et al 1994a
|
|
|
Relative tissue concentrations of organochlorine compounds detected in lichen, and in adipose tissue of caribou and wolf at three locations in the Northwest Territories, Canada
|

|
|
Observed and predicted organochlorine concentrations (ng/g ww) in caribou and reindeer (Rangifer tarandus) liver All data are presented in, or were derived from data in Annex Table 6A4
|
|
|
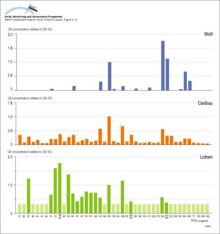
Concentrations of PCB congeners relative to PCB congener 153 for lichen, caribou, and wolf in the Bathurst herd, Canada The light bars denote that the congener was not detected
|
|
|
Temporal trends in OC levels (ng/g lw) in reindeer from Abisko, Sweden Levels are usually based on a pool of 10 samples
|

|
|
Deposition of PCBs, as mono/di/trichloro- and tetra-nonachlorobiphenyls) in snow cores from the Agassiz Ice Cap (northern Ellesmere Island, Canada) Combined light and dark shaded sections of each bar [..]
|

|
|
Temporal trends in concentrations of sum-HCH and toxaphene in Arctic air
|

|
|
Temporal trends in PCB and DDT levels (µg/g lw ± 95% confidence limits) of otter muscle in Sweden Levels are based on means of 26, 16, and 28 samples (northern Sweden) and 29, 9, and 15 samples [..]
|

|
|
Historical profiles of PCBs (trichloro- and all other) in slices from dated sediment cores in Alaska, Canada, and Finland Median age of each slice is given on the vertical axis The green lines [..]
|

|
|
Concentrations, as geometric means, of major organochlorine groups in burbot liver at Fort Good Hope, NWT, Canada (1986-94) Vertical bars denote standard errors
|

|

water OR waste searches for either of these words
oceans AND biodiversity searches for blocks with both words
pollution NEAR water searches for blocks with either of these words, with them being closer ranks higher
"climate change" searches for this phrase