Your query returned 101 graphics.
Results 16 - 30
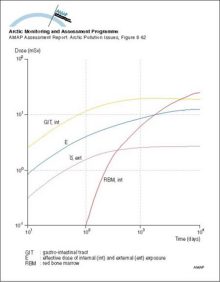
Dose accumulation in adult rural residents after the Kyshtym accident in 1957Dose accumulation in adult rural residents after the Kyshtym accident in 1957 |
|
Photograph of a submarine being provided with cooling water from a supply shipPhotograph of a submarine being provided with cooling water from a supply ship |

|
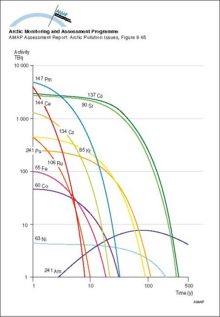
The changing inventory of major radionuclides in the Komsomolets reactor with timeThe changing inventory of major radionuclides in the Komsomolets reactor with time |
|
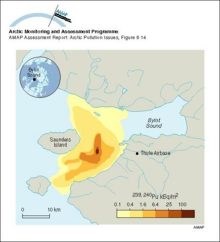
Activity concentrations of 239,240Pu in sediments near Thule, GreenlandActivity concentrations of 239,240Pu in sediments near Thule, Greenland |
|
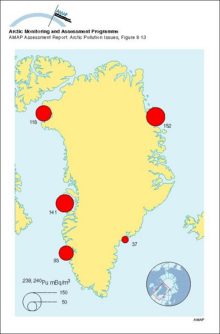
Concentrations of 239,240Pu in seawater around Greenland, 1968Concentrations of 239,240Pu in seawater around Greenland, 1968 |
|
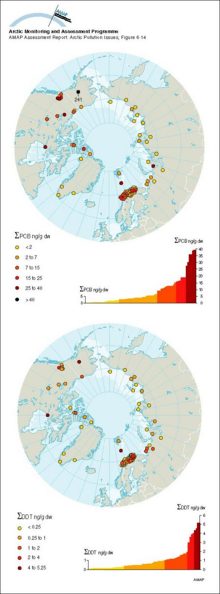
Concentrations of sum-PCB and sum-DDT in surface sediments (from grab samples or from top slices of cores) on a circumpolar basis, and the ranked distribution of valuesConcentrations of sum-PCB and sum-DDT in surface sediments (from grab samples or from top slices of cores) on a circumpolar basis, and the ranked distribution of values |
|
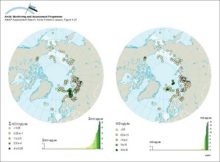
Concentrations of sum-DDT and sum-PCB in marine surface sediments (from grab samples or from top slices of cores) on a circumpolar basis, and the ranked distribution of valuesConcentrations of sum-DDT and sum-PCB in marine surface sediments (from grab samples or from top slices of cores) on a circumpolar basis, and the ranked distribution of values |
|
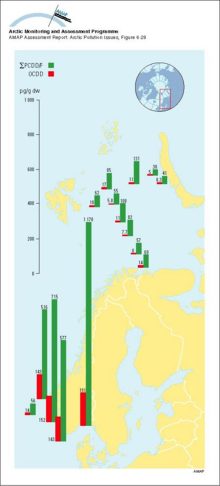
Concentration (pg/g dw) profiles for octachlorodioxin (OCDD) and total PCDD/Fs in marine sediments from southern and western Norwegian waters and from the Barents SeaConcentration (pg/g dw) profiles for octachlorodioxin (OCDD) and total PCDD/Fs in marine sediments from southern and western Norwegian waters and from the Barents Sea |
|
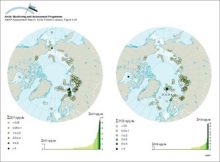
Concentrations of sum-HCH and HCB in marine surface sediments (from grab samples or from top slices of cores) on a circumpolar basis, and the ranked distribution of valuesConcentrations of sum-HCH and HCB in marine surface sediments (from grab samples or from top slices of cores) on a circumpolar basis, and the ranked distribution of values |
|
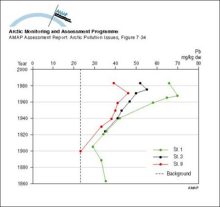
Lead in sediments near the cryolite mine at Ivittuut, south Greenland Stations 1, 3 and 9 are located at distances of 800 m, 1600 m and 5600 m, respectively, from the mineLead in sediments near the cryolite mine at Ivittuut, south Greenland Stations 1, 3 and 9 are located at distances of 800 m, 1600 m and 5600 m, respectively, from the mine |
|
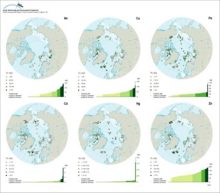
Concentrations of metals in fine-grained surface marine sediments in the ArcticConcentrations of metals in fine-grained surface marine sediments in the Arctic |
|
Average annual maximum and minimum sea ice extent The numbered lines show the expected time in years for the ice at that location to exit the Arctic Ocean through the Fram Strait, based on drifting buoy data during 1979-1990Average annual maximum and minimum sea ice extent The numbered lines show the expected time in years for the ice at that location to exit the Arctic Ocean through the Fram Strait, based on drifting [..] |

|
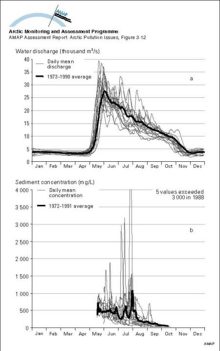
a) The annual (1973-1990) and mean annual hydrographs for the Mackenzie River above the Arctic Red River, NWT, Canada, indicating the dominance of the spring freshet in Maya) The annual (1973-1990) and mean annual hydrographs for the Mackenzie River above the Arctic Red River, NWT, Canada, indicating the dominance of the spring freshet in May |
|
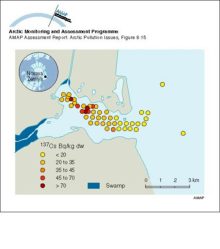
Activity concentrations of 137Cs in sediments of Abrosimov BayActivity concentrations of 137Cs in sediments of Abrosimov Bay |
|
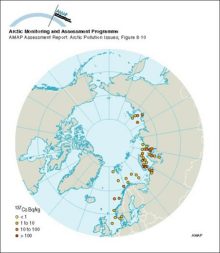
Average 137Cs activity concentrations in surface sediments of some Arctic seas sampled from 1992 to 1995Average 137Cs activity concentrations in surface sediments of some Arctic seas sampled from 1992 to 1995 |
|

water OR waste searches for either of these words
oceans AND biodiversity searches for blocks with both words
pollution NEAR water searches for blocks with either of these words, with them being closer ranks higher
"climate change" searches for this phrase