|
History of temperature changes in central Greenland over the last 40 000 years, from the GISP2 core, showing very large and probably abrupt changes
|

|
|
History of snow accumulation in central Greenland during the most recent glaciation, as measured in the GISP2 core The 25-year running mean, represented in all panels, shows very large and rapid [..]
|

|
|
Trends in (annual average) ozone mixing ratio over Canada from 1980 to 1993
|

|
|
Body burdens of radiocaesium (yearly averages) across the Canadian Arctic
|

|
|
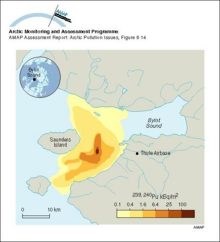
Activity concentrations of 239,240Pu in sediments near Thule, Greenland
|
|
|
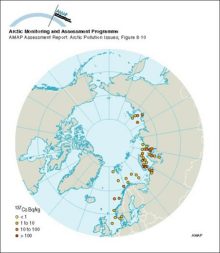
Average 137Cs activity concentrations in surface sediments of some Arctic seas sampled from 1992 to 1995
|
|
|
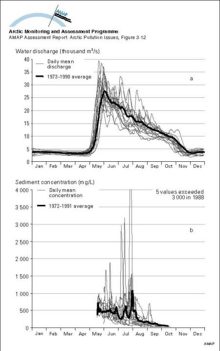
a) The annual (1973-1990) and mean annual hydrographs for the Mackenzie River above the Arctic Red River, NWT, Canada, indicating the dominance of the spring freshet in May
|
|
|
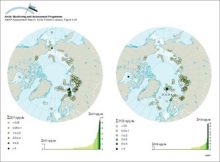
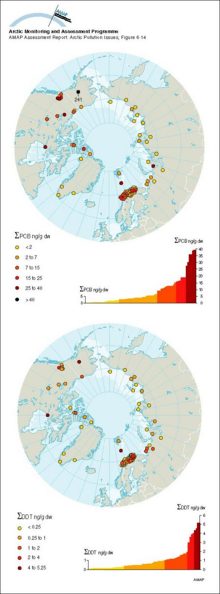
Concentrations of sum-DDT and sum-PCB in marine surface sediments (from grab samples or from top slices of cores) on a circumpolar basis, and the ranked distribution of values
|
|
|
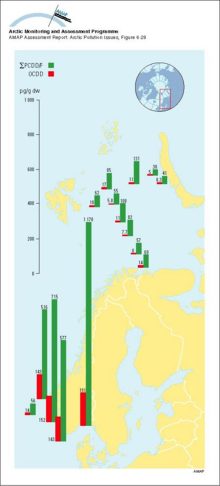
Concentration (pg/g dw) profiles for octachlorodioxin (OCDD) and total PCDD/Fs in marine sediments from southern and western Norwegian waters and from the Barents Sea
|
|
|
Concentrations of sum-HCH and HCB in marine surface sediments (from grab samples or from top slices of cores) on a circumpolar basis, and the ranked distribution of values
|
|
|
Average annual maximum and minimum sea ice extent The numbered lines show the expected time in years for the ice at that location to exit the Arctic Ocean through the Fram Strait, based on drifting [..]
|

|
|
Concentrations of sum-PCB and sum-DDT in surface sediments (from grab samples or from top slices of cores) on a circumpolar basis, and the ranked distribution of values
|
|
|
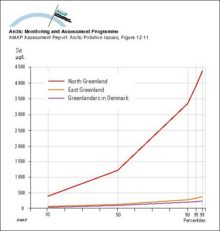
Distribution (in percentiles) of whole blood selenium concentrations in East and North Greenland and in Greenlanders living in Denmark
|
|
|
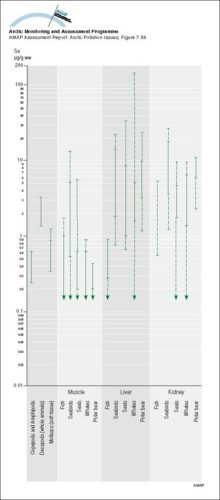
Summary of ranges of Se levels (mean values) in Arctic marine organisms Solid parts of the lines indicate ranges for Greenlandic data
|
|

water OR waste searches for either of these words
oceans AND biodiversity searches for blocks with both words
pollution NEAR water searches for blocks with either of these words, with them being closer ranks higher
"climate change" searches for this phrase