Your query returned 80 graphics.
Results 76 - 80
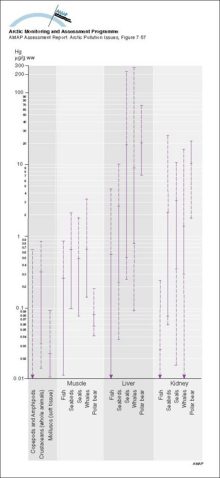
Summary of ranges of Hg levels (mean values) in Arctic marine organisms Solid parts of the lines indicate ranges for Greenlandic dataSummary of ranges of Hg levels (mean values) in Arctic marine organisms Solid parts of the lines indicate ranges for Greenlandic data |
|
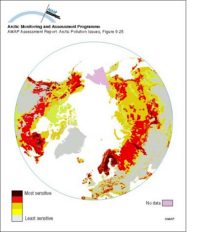
Sensitivity of Arctic ecosystems to acid depositionSensitivity of Arctic ecosystems to acid deposition |
|
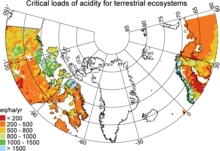
Critical loads of acidity for soilsCritical loads of acidity for terrestrial ecosystems in northern Europe and Canada north of 60 degrees N. |
|
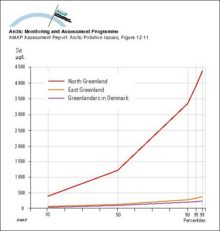
Distribution (in percentiles) of whole blood selenium concentrations in East and North Greenland and in Greenlanders living in DenmarkDistribution (in percentiles) of whole blood selenium concentrations in East and North Greenland and in Greenlanders living in Denmark |
|
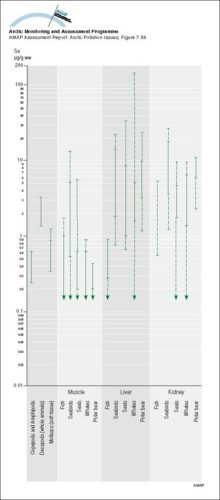
Summary of ranges of Se levels (mean values) in Arctic marine organisms Solid parts of the lines indicate ranges for Greenlandic dataSummary of ranges of Se levels (mean values) in Arctic marine organisms Solid parts of the lines indicate ranges for Greenlandic data |
|

water OR waste searches for either of these words
oceans AND biodiversity searches for blocks with both words
pollution NEAR water searches for blocks with either of these words, with them being closer ranks higher
"climate change" searches for this phrase