Your query returned 158 graphics.
Results 16 - 30
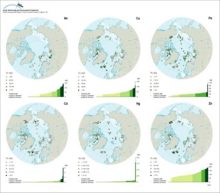
Concentrations of metals in fine-grained surface marine sediments in the ArcticConcentrations of metals in fine-grained surface marine sediments in the Arctic |
|
Changes with time in 137Cs contamination in the food chain lichen - reindeer - humansChanges with time in 137Cs contamination in the food chain lichen - reindeer - humans |

|
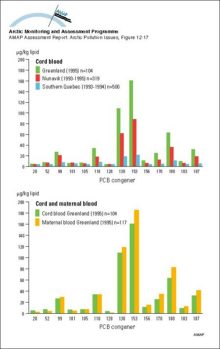
PCB congener profiles in cord blood of Canadian and Greenlandic population groups, and in cord and maternal blood from GreenlandPCB congener profiles in cord blood of Canadian and Greenlandic population groups, and in cord and maternal blood from Greenland |
|
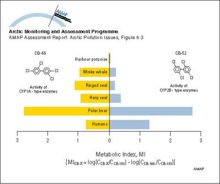
Cytochrome P450 1A (CYP1A) and cytochrome P4502B (CYP2B) type enzyme activities in some Arctic marine mammals and humans using the metabolic index (MI) suggested by Tanabe et al 1994aCytochrome P450 1A (CYP1A) and cytochrome P4502B (CYP2B) type enzyme activities in some Arctic marine mammals and humans using the metabolic index (MI) suggested by Tanabe et al 1994a |
|
Temporal trends in OC levels (ng/g lw) in reindeer from Abisko, Sweden Levels are usually based on a pool of 10 samplesTemporal trends in OC levels (ng/g lw) in reindeer from Abisko, Sweden Levels are usually based on a pool of 10 samples |

|
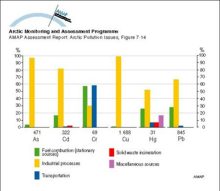
Estimates of emissions of As, Cd, Hg and Pb to the atmosphere from major source categories in the United States Numbers under the columns are emissions in tonnes per yearEstimates of emissions of As, Cd, Hg and Pb to the atmosphere from major source categories in the United States Numbers under the columns are emissions in tonnes per year |

|
Estimates of emissions of As, Cd, Cr, Cu, Hg and Pb to the atmosphere from major source categories in Canada in 1982 Numbers under the columns are emissions in tonnes per yearEstimates of emissions of As, Cd, Cr, Cu, Hg and Pb to the atmosphere from major source categories in Canada in 1982 Numbers under the columns are emissions in tonnes per year |
|
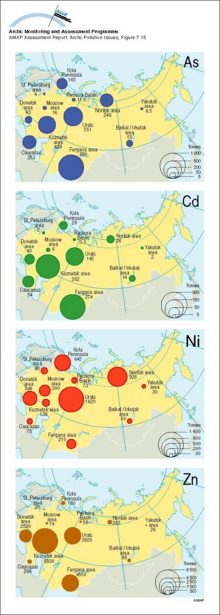
Emissions of As, Cd, Ni and Zn to the atmosphere from major sources in the former Soviet Union in 1979/80Emissions of As, Cd, Ni and Zn to the atmosphere from major sources in the former Soviet Union in 1979/80 |
|
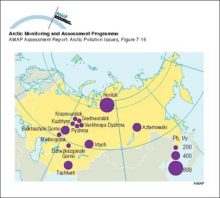
Major point sources (non-ferrous metal smelters) of Pb to the atmosphere in the Urals and the Asian part of the former Soviet UnionMajor point sources (non-ferrous metal smelters) of Pb to the atmosphere in the Urals and the Asian part of the former Soviet Union |
|
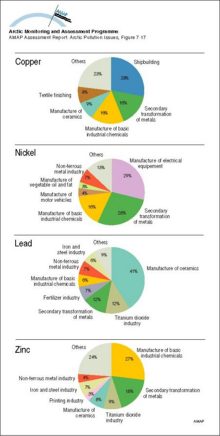
The relative importance of different branches of industry in discharges of Cu, Ni, Pb and Zn to the aquatic environment from major point sources in the European Community (EC)The relative importance of different branches of industry in discharges of Cu, Ni, Pb and Zn to the aquatic environment from major point sources in the European Community (EC) |
|
Averaged upper (3000 m) air concentrations of Pb in winter (December-February) and summer (June-August) as modeled by the updated (1996) hemispheric EMEP transport model in a simulation for the reference year 1988Averaged upper (3000 m) air concentrations of Pb in winter (December-February) and summer (June-August) as modeled by the updated (1996) hemispheric EMEP transport model in a simulation for the [..] |

|
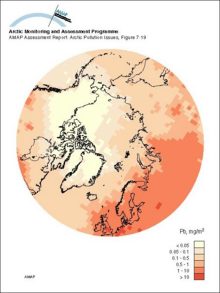
Lead deposition as modeled by the updated (1996) hemispheric EMEP transport model in a simulation for the reference year 1988Lead deposition as modeled by the updated (1996) hemispheric EMEP transport model in a simulation for the reference year 1988 |
|
Average contributions from various sources to the atmospheric concentrations of elements in winter air samples at Ny-Ålesund, SvalbardAverage contributions from various sources to the atmospheric concentrations of elements in winter air samples at Ny-Ålesund, Svalbard |

|
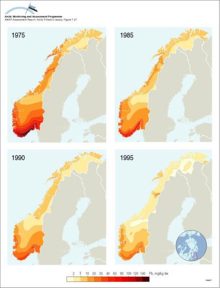
Latitudinal gradient of deposition of Pb in Norway in different years, as reflected by Pb concentrations in mossLatitudinal gradient of deposition of Pb in Norway in different years, as reflected by Pb concentrations in moss |
|
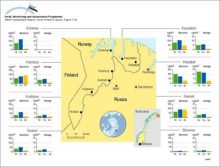
Average (15-month) and 24-h average maximum air concentrations of Ni, Cu and As measured at several stations in northern Norway near to major point sources on the Kola PeninsulaAverage (15-month) and 24-h average maximum air concentrations of Ni, Cu and As measured at several stations in northern Norway near to major point sources on the Kola Peninsula |
|

water OR waste searches for either of these words
oceans AND biodiversity searches for blocks with both words
pollution NEAR water searches for blocks with either of these words, with them being closer ranks higher
"climate change" searches for this phrase